Yes, we have lots of data!!
Scroll down to find crime rates by city, crime stats for Memphis, clearance rates, and case disposition rates. Check back frequently as we continue to update and add new data as it becomes available.
“You can’t manage it if you can’t measure it”
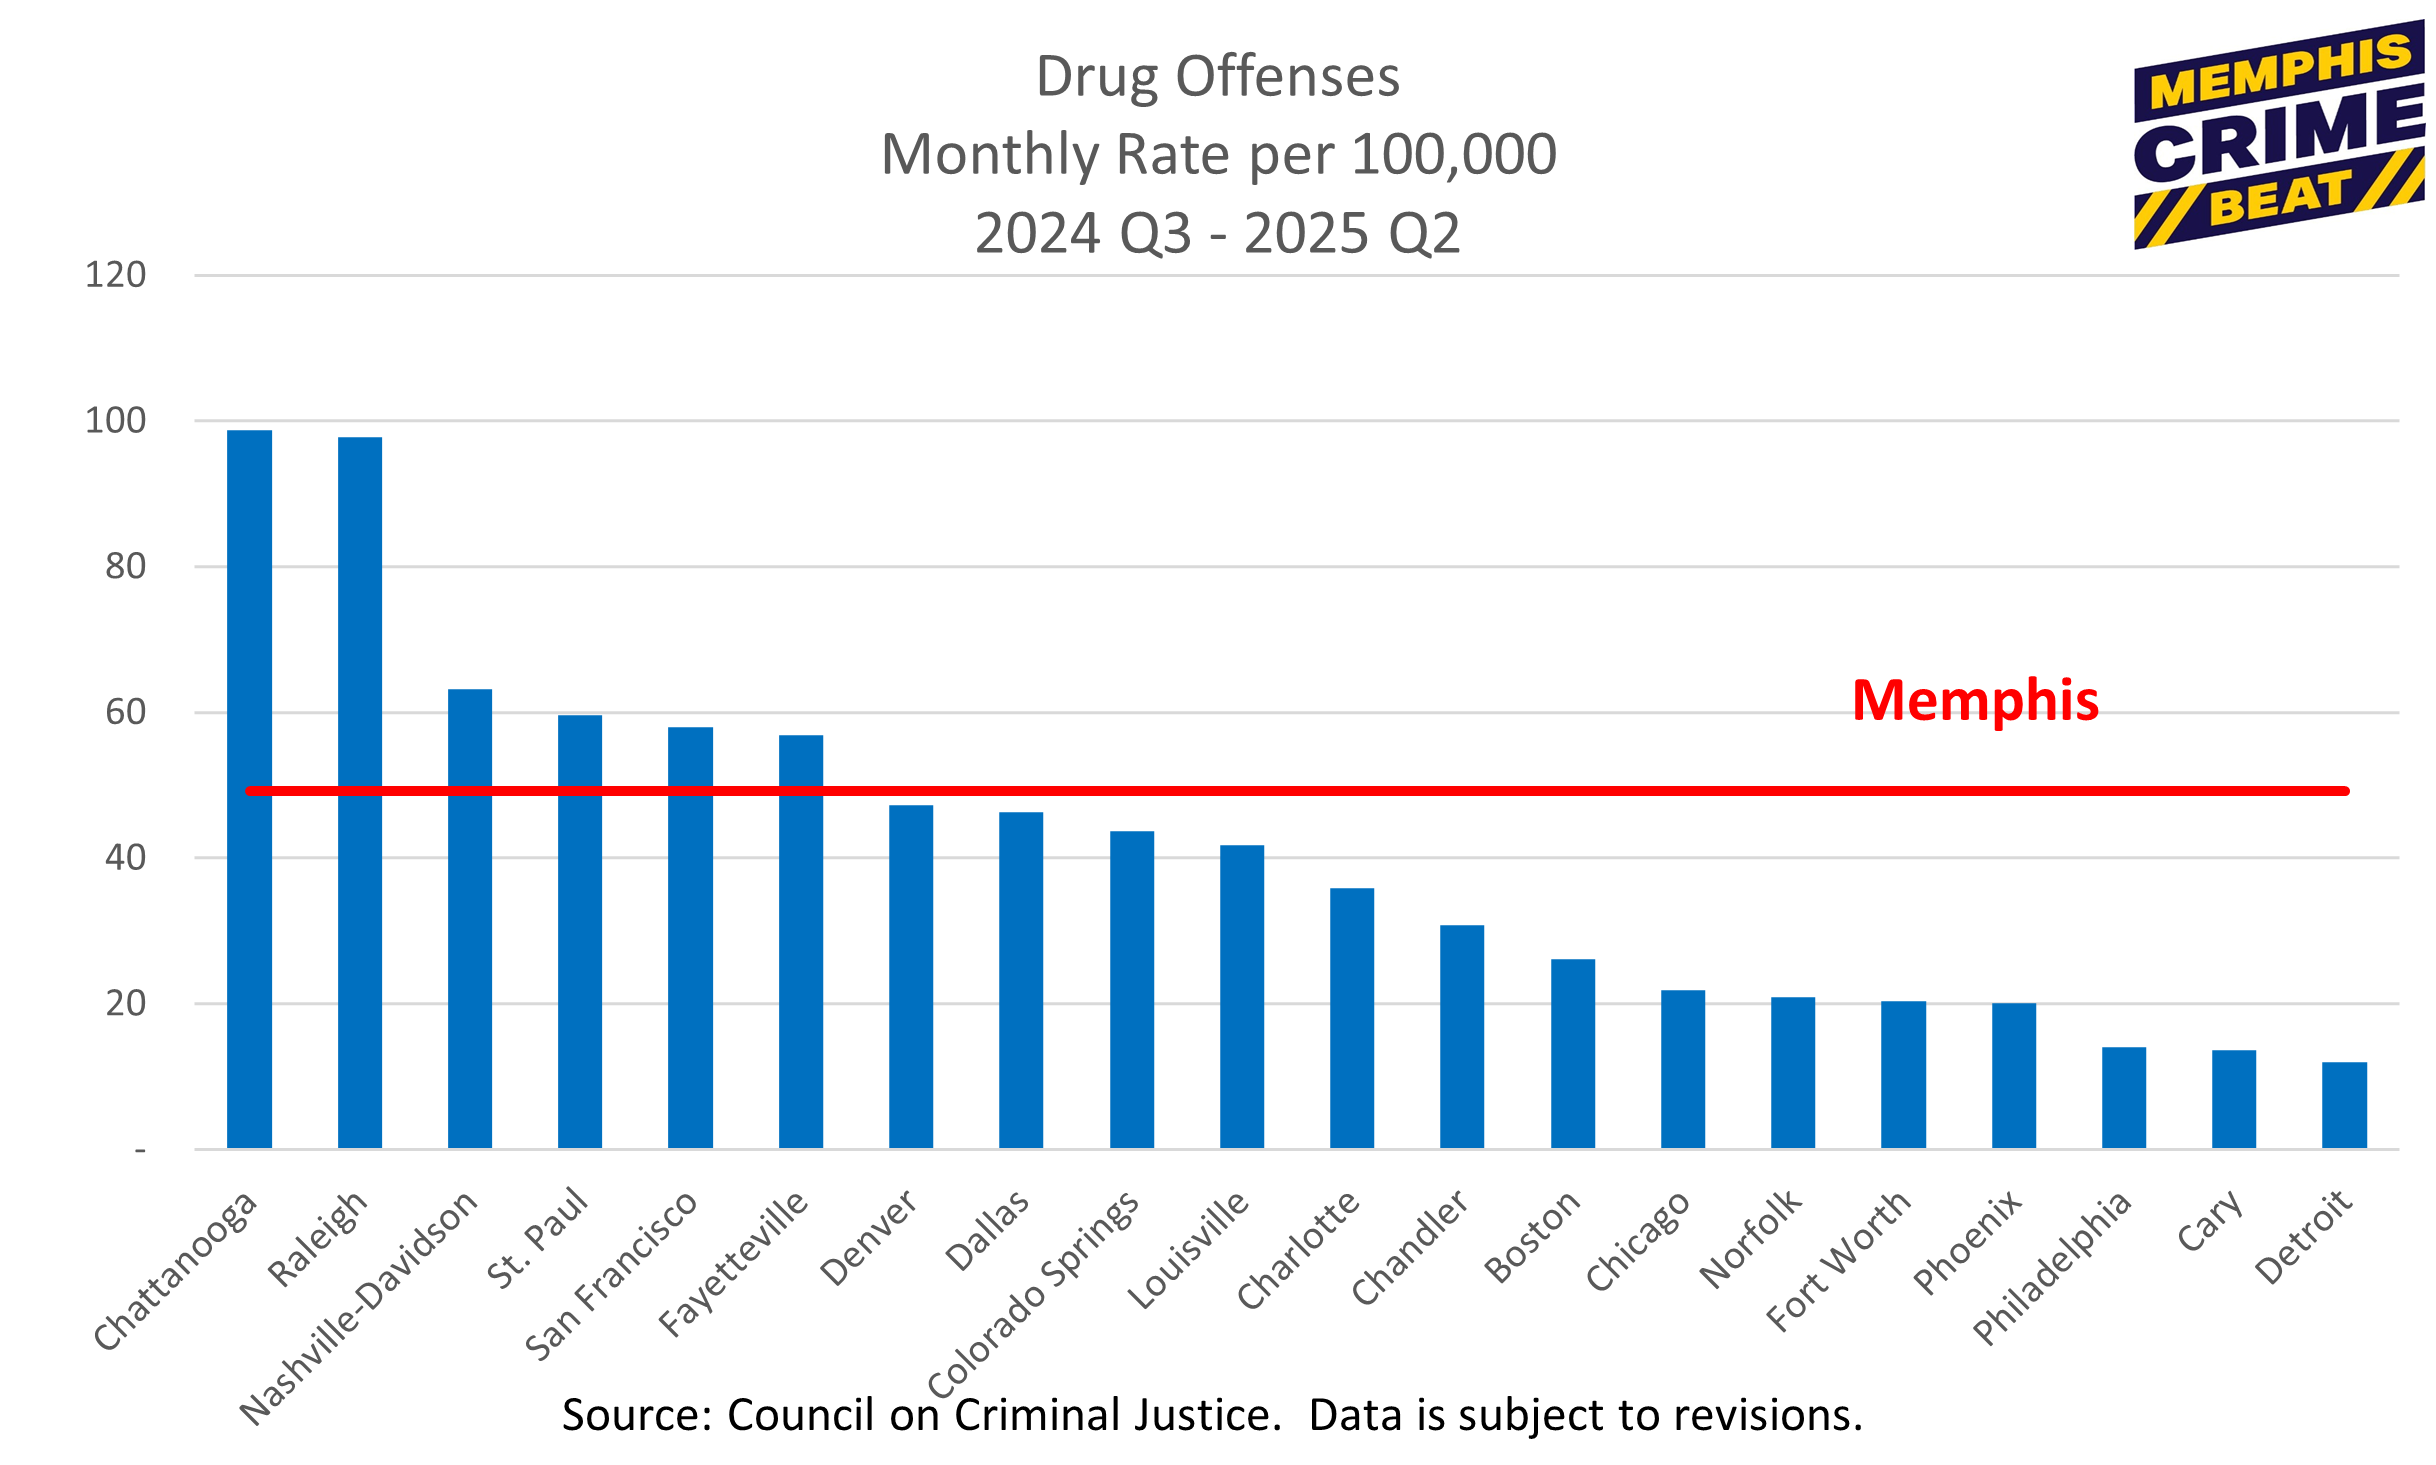
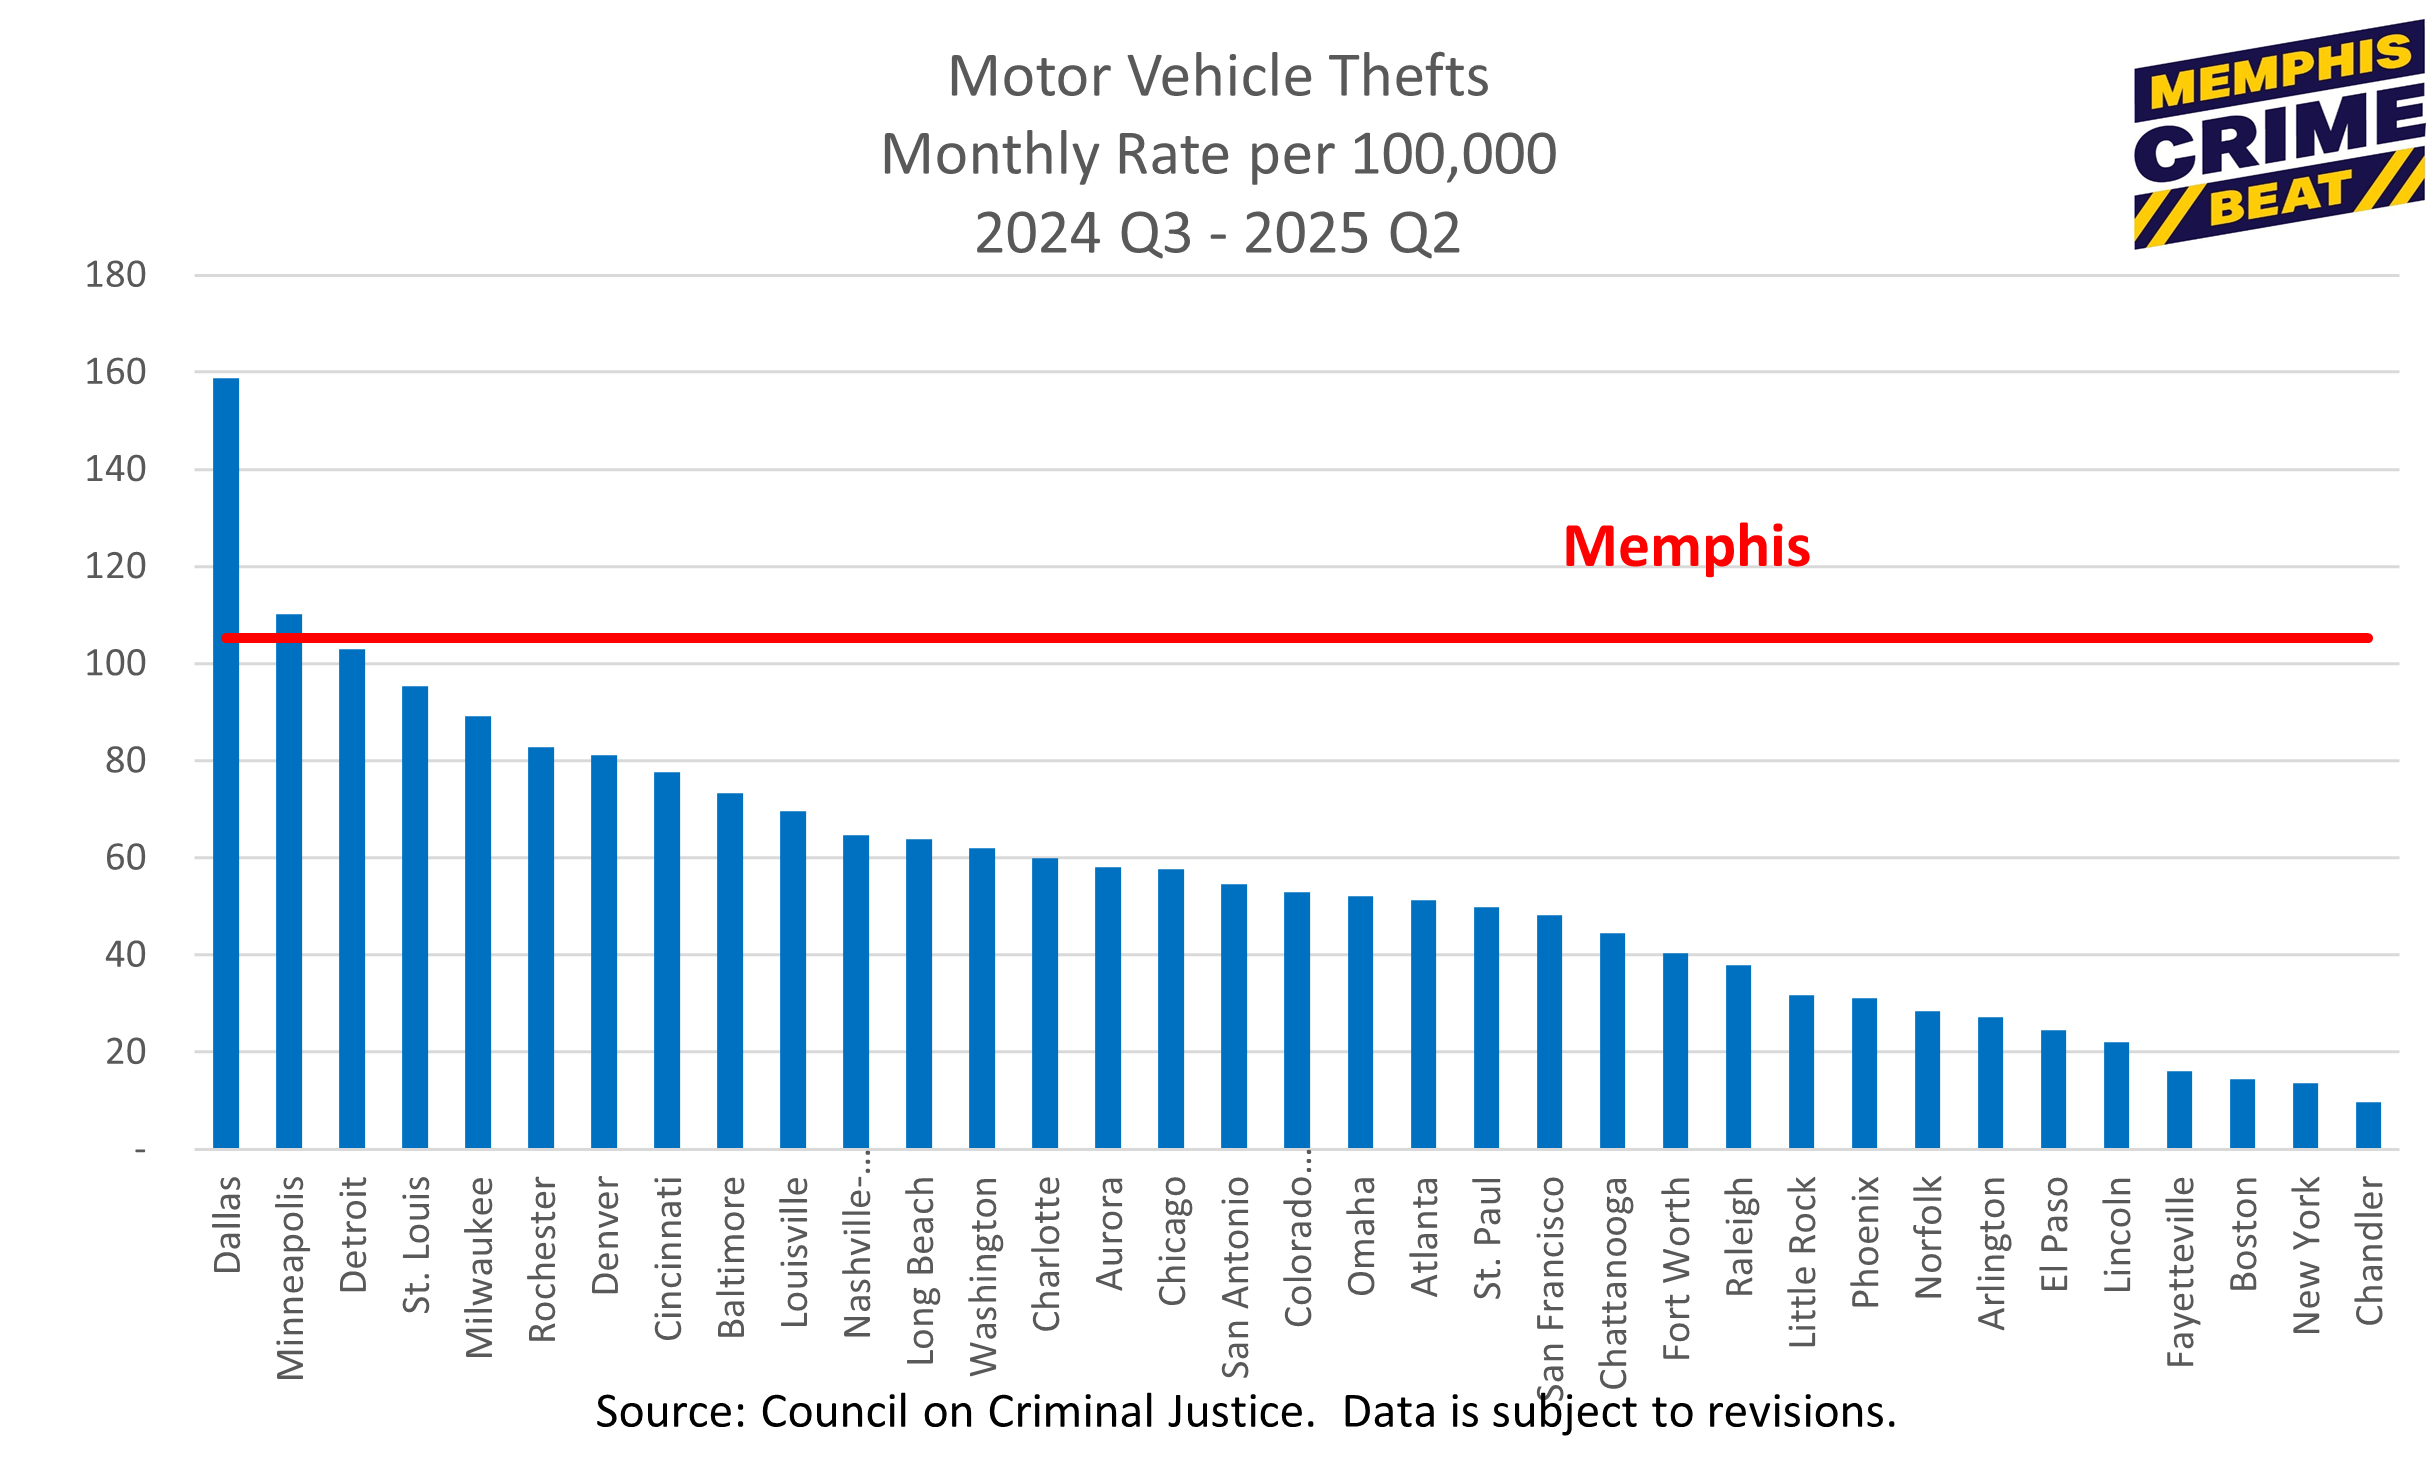
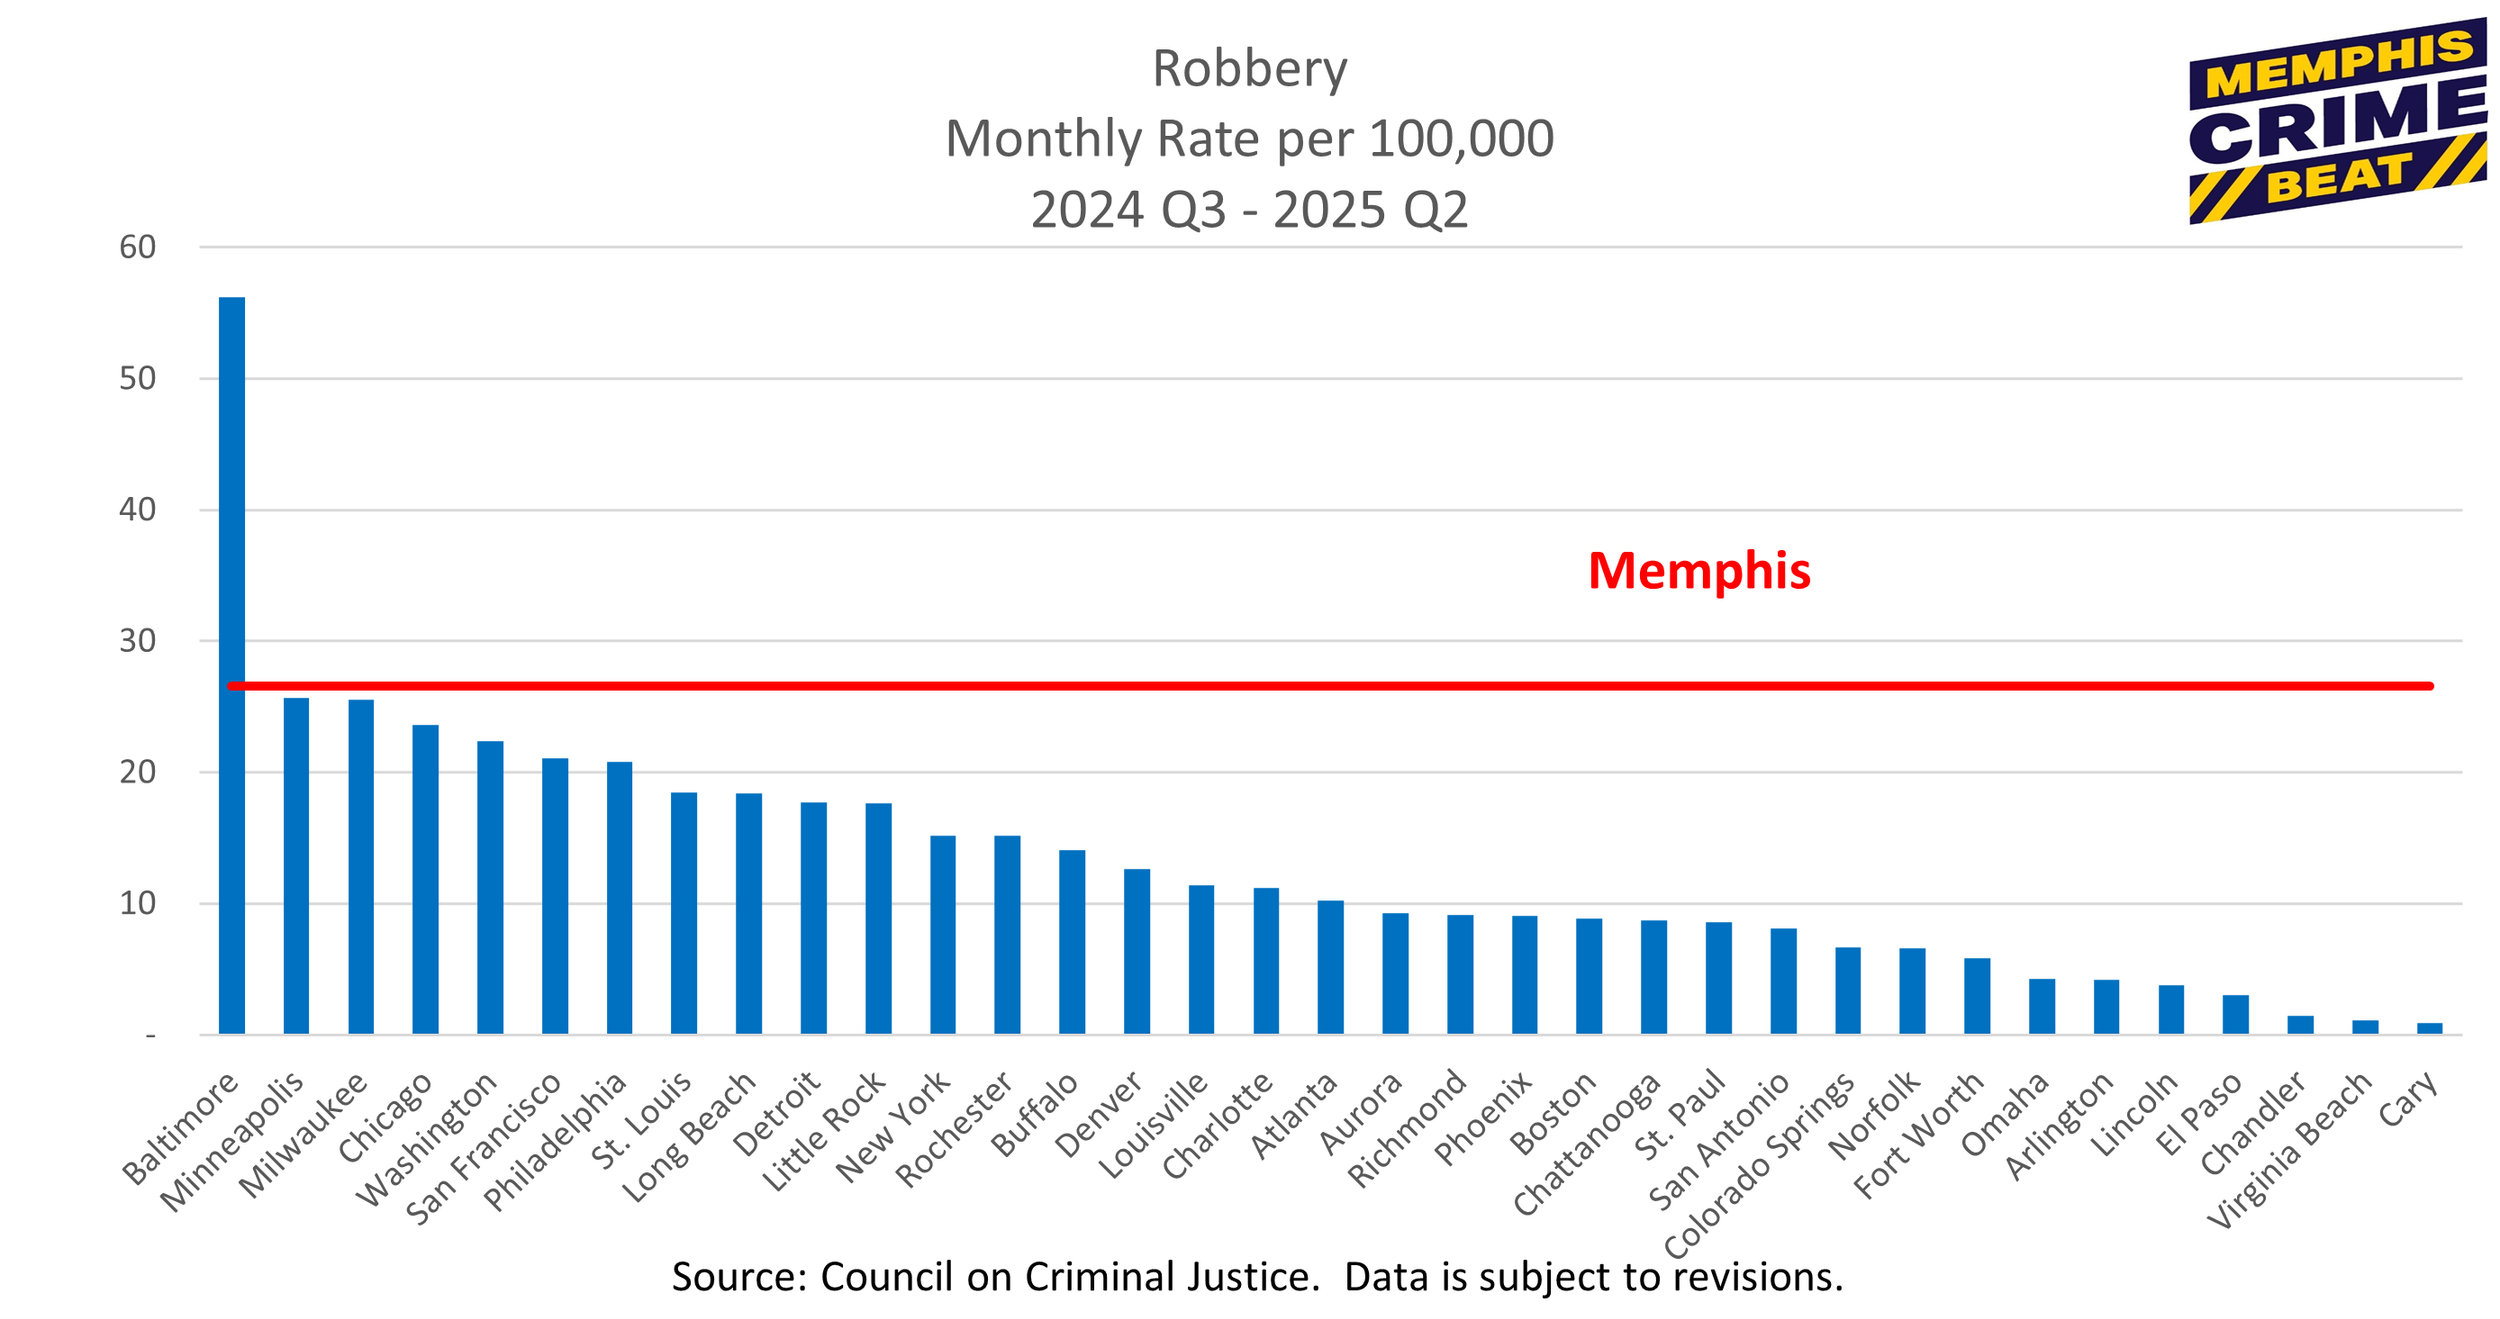
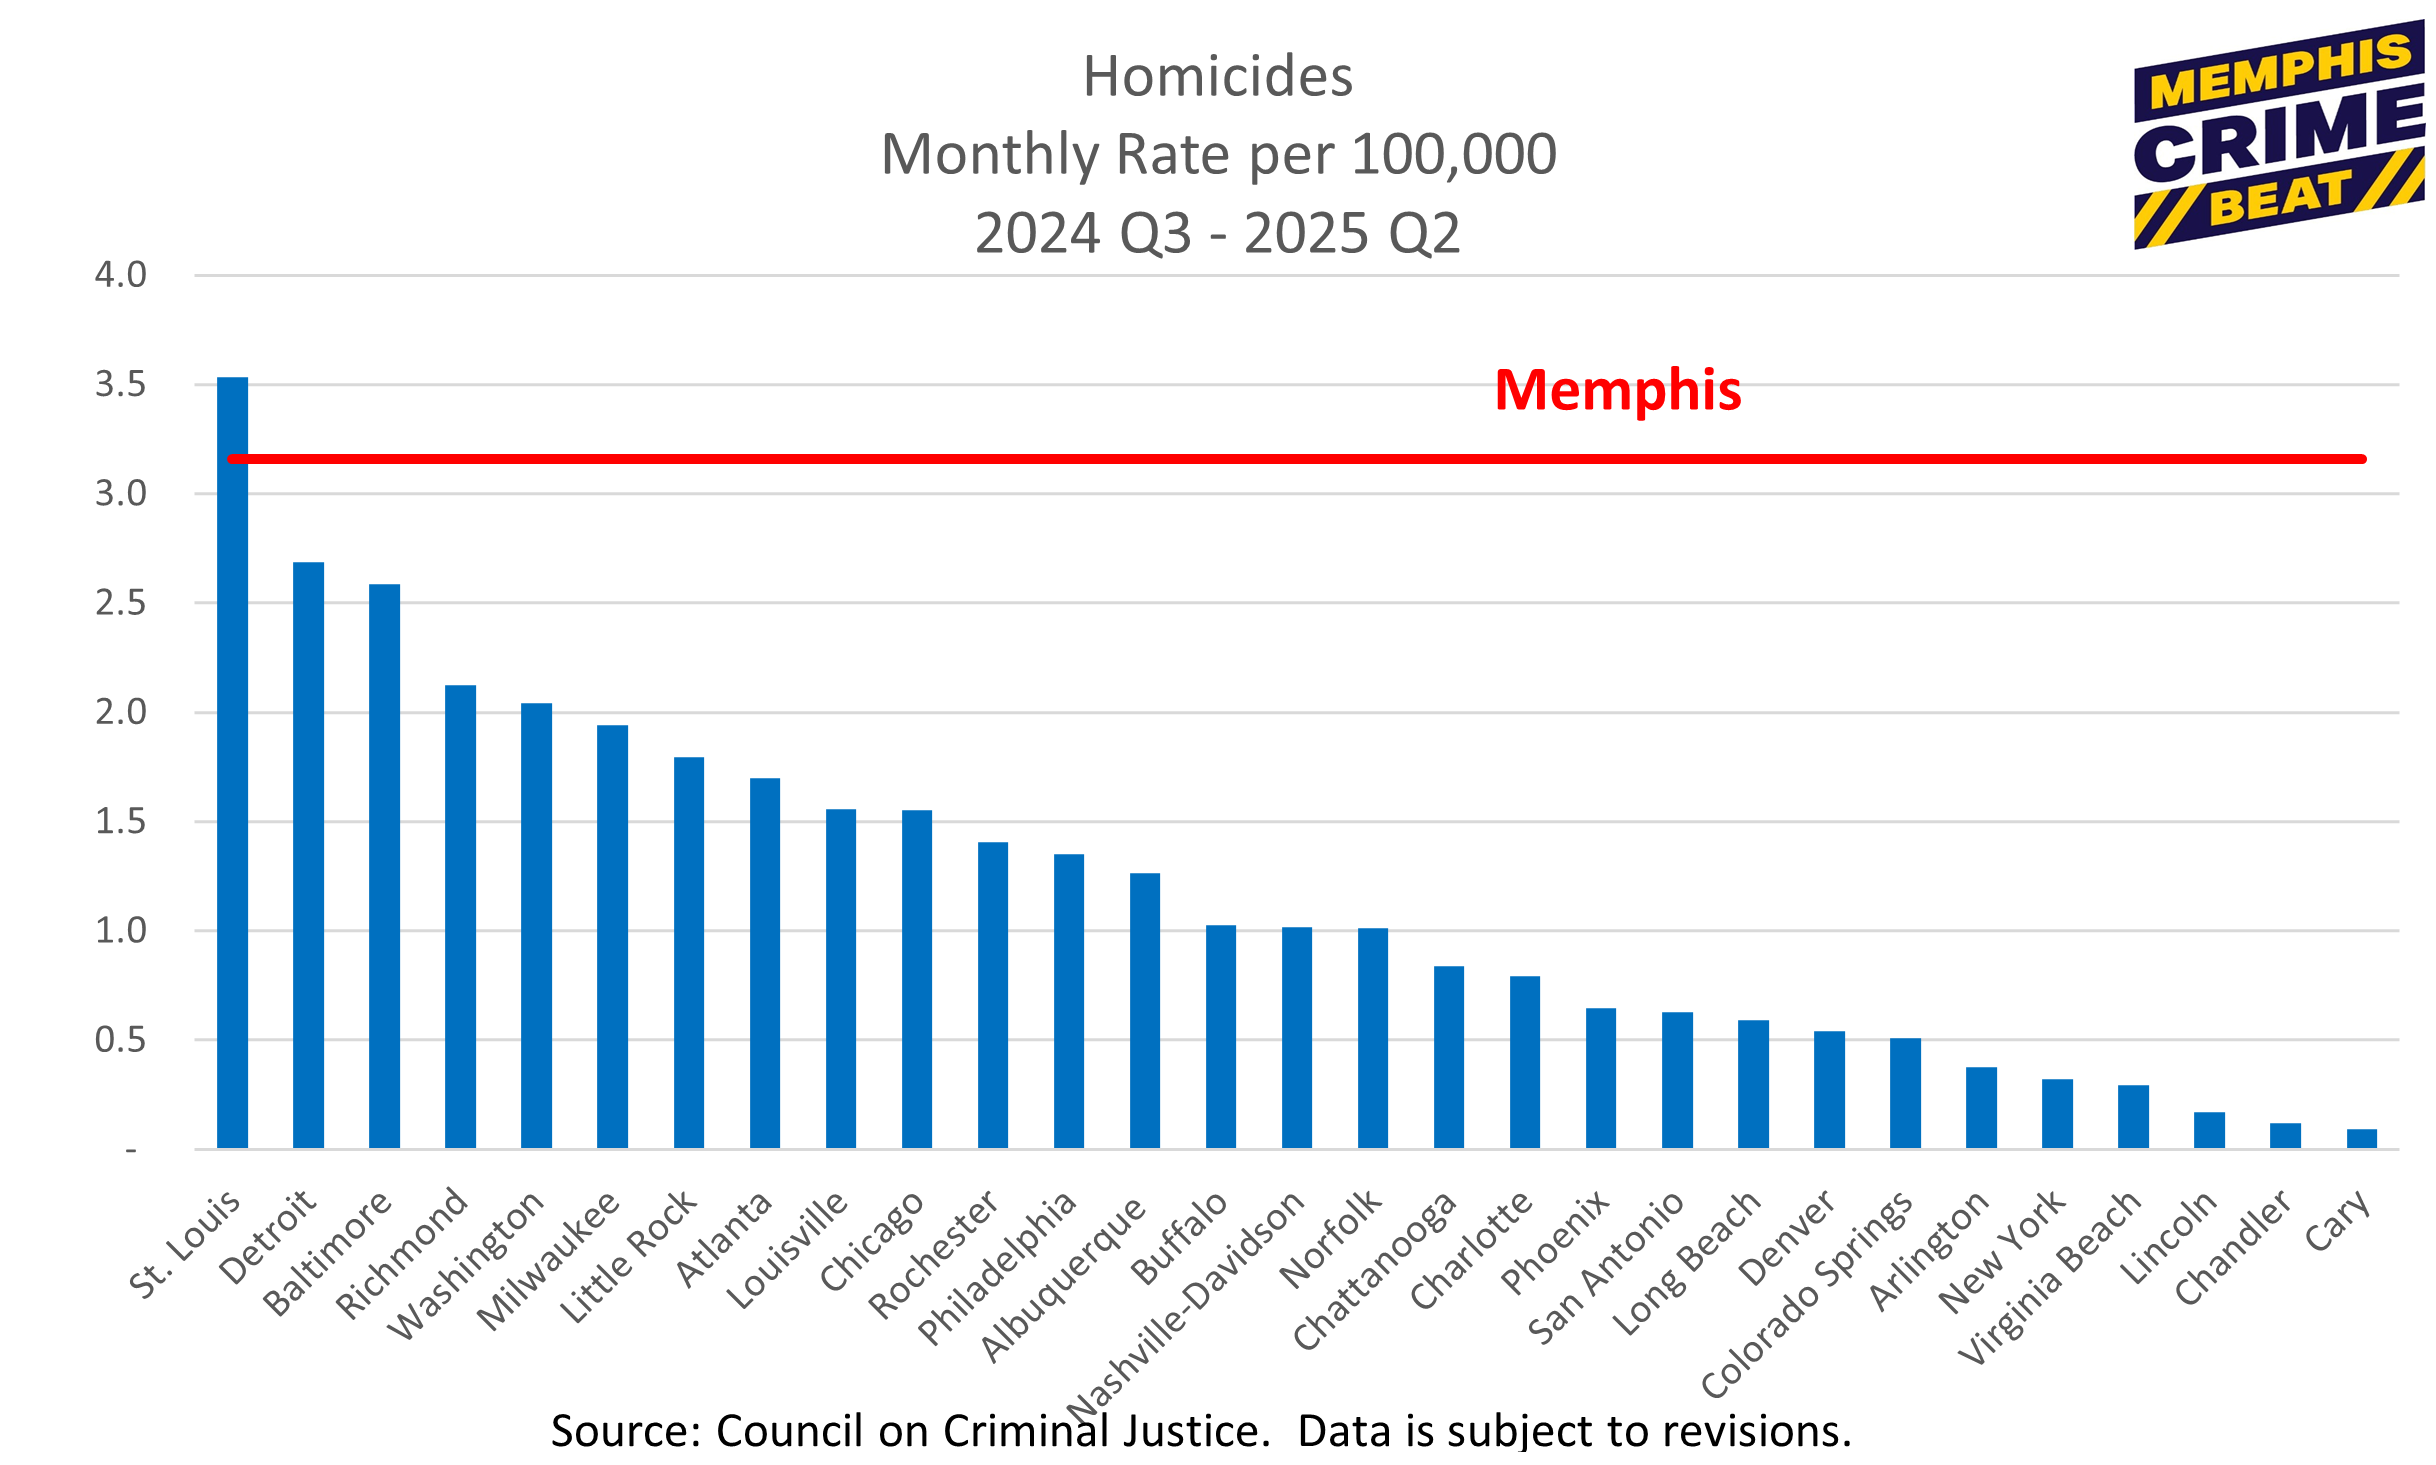
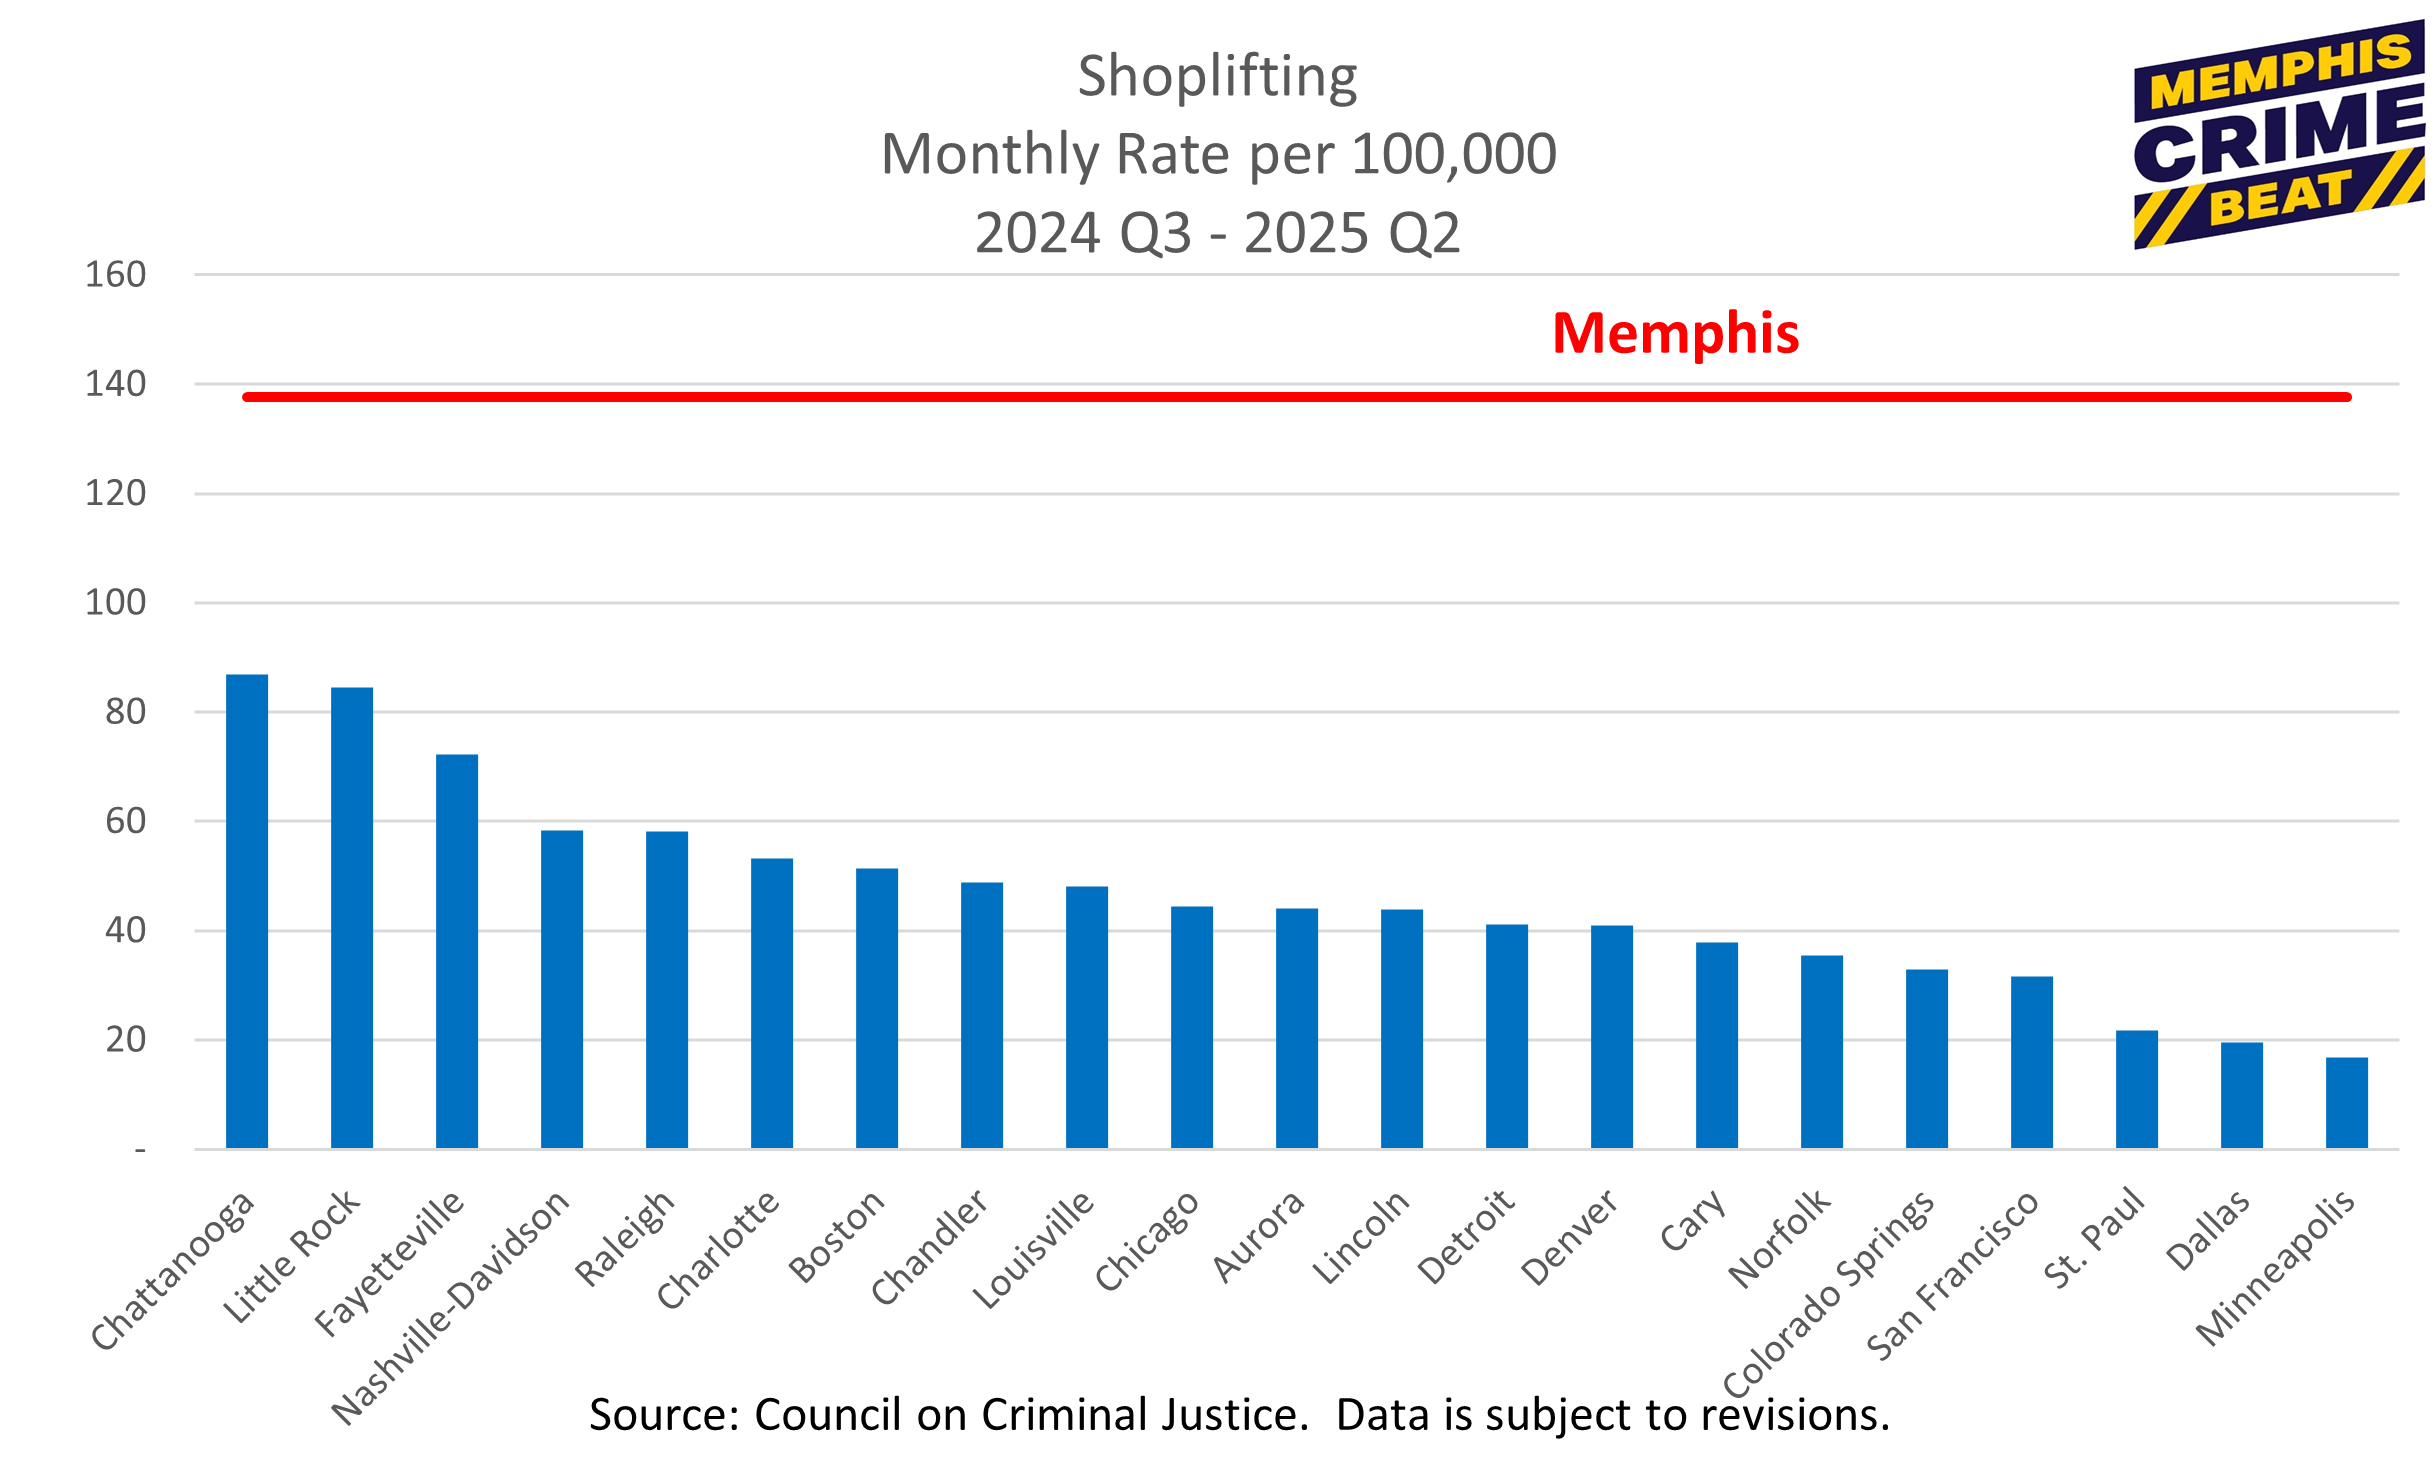
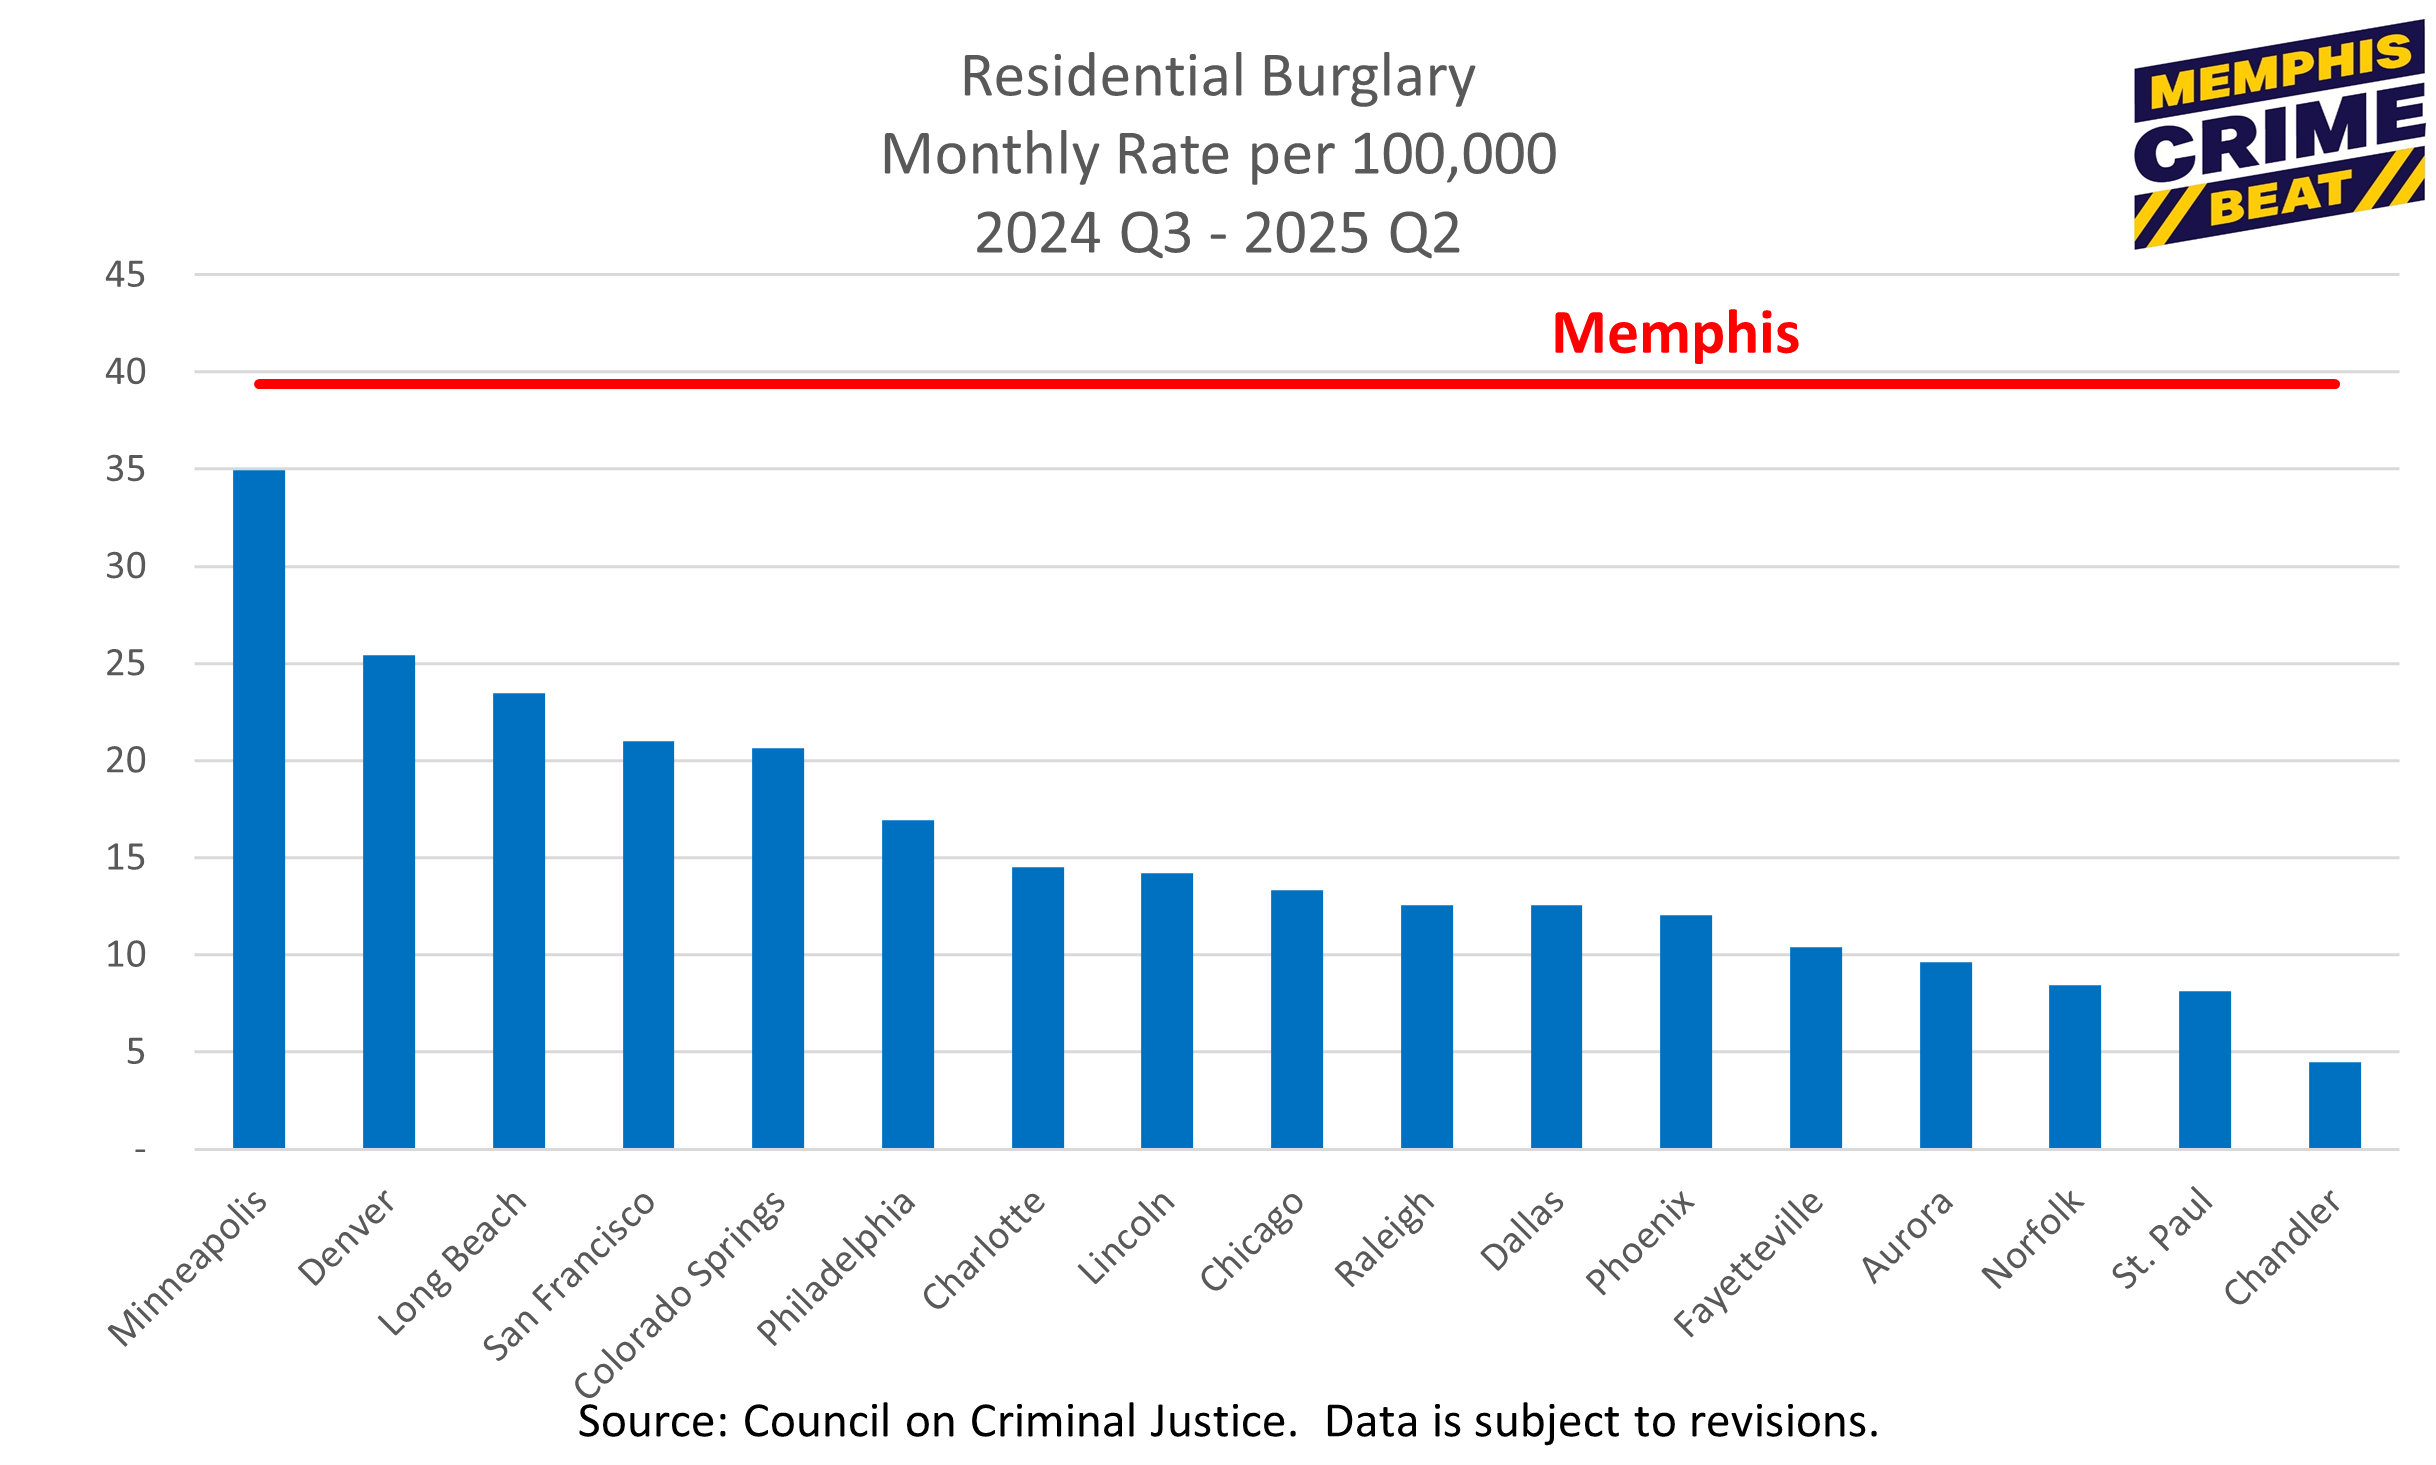
crime rates by City
Source: The Council on Criminal Justice. Not all cities report all crimes. The data is subject to revision.


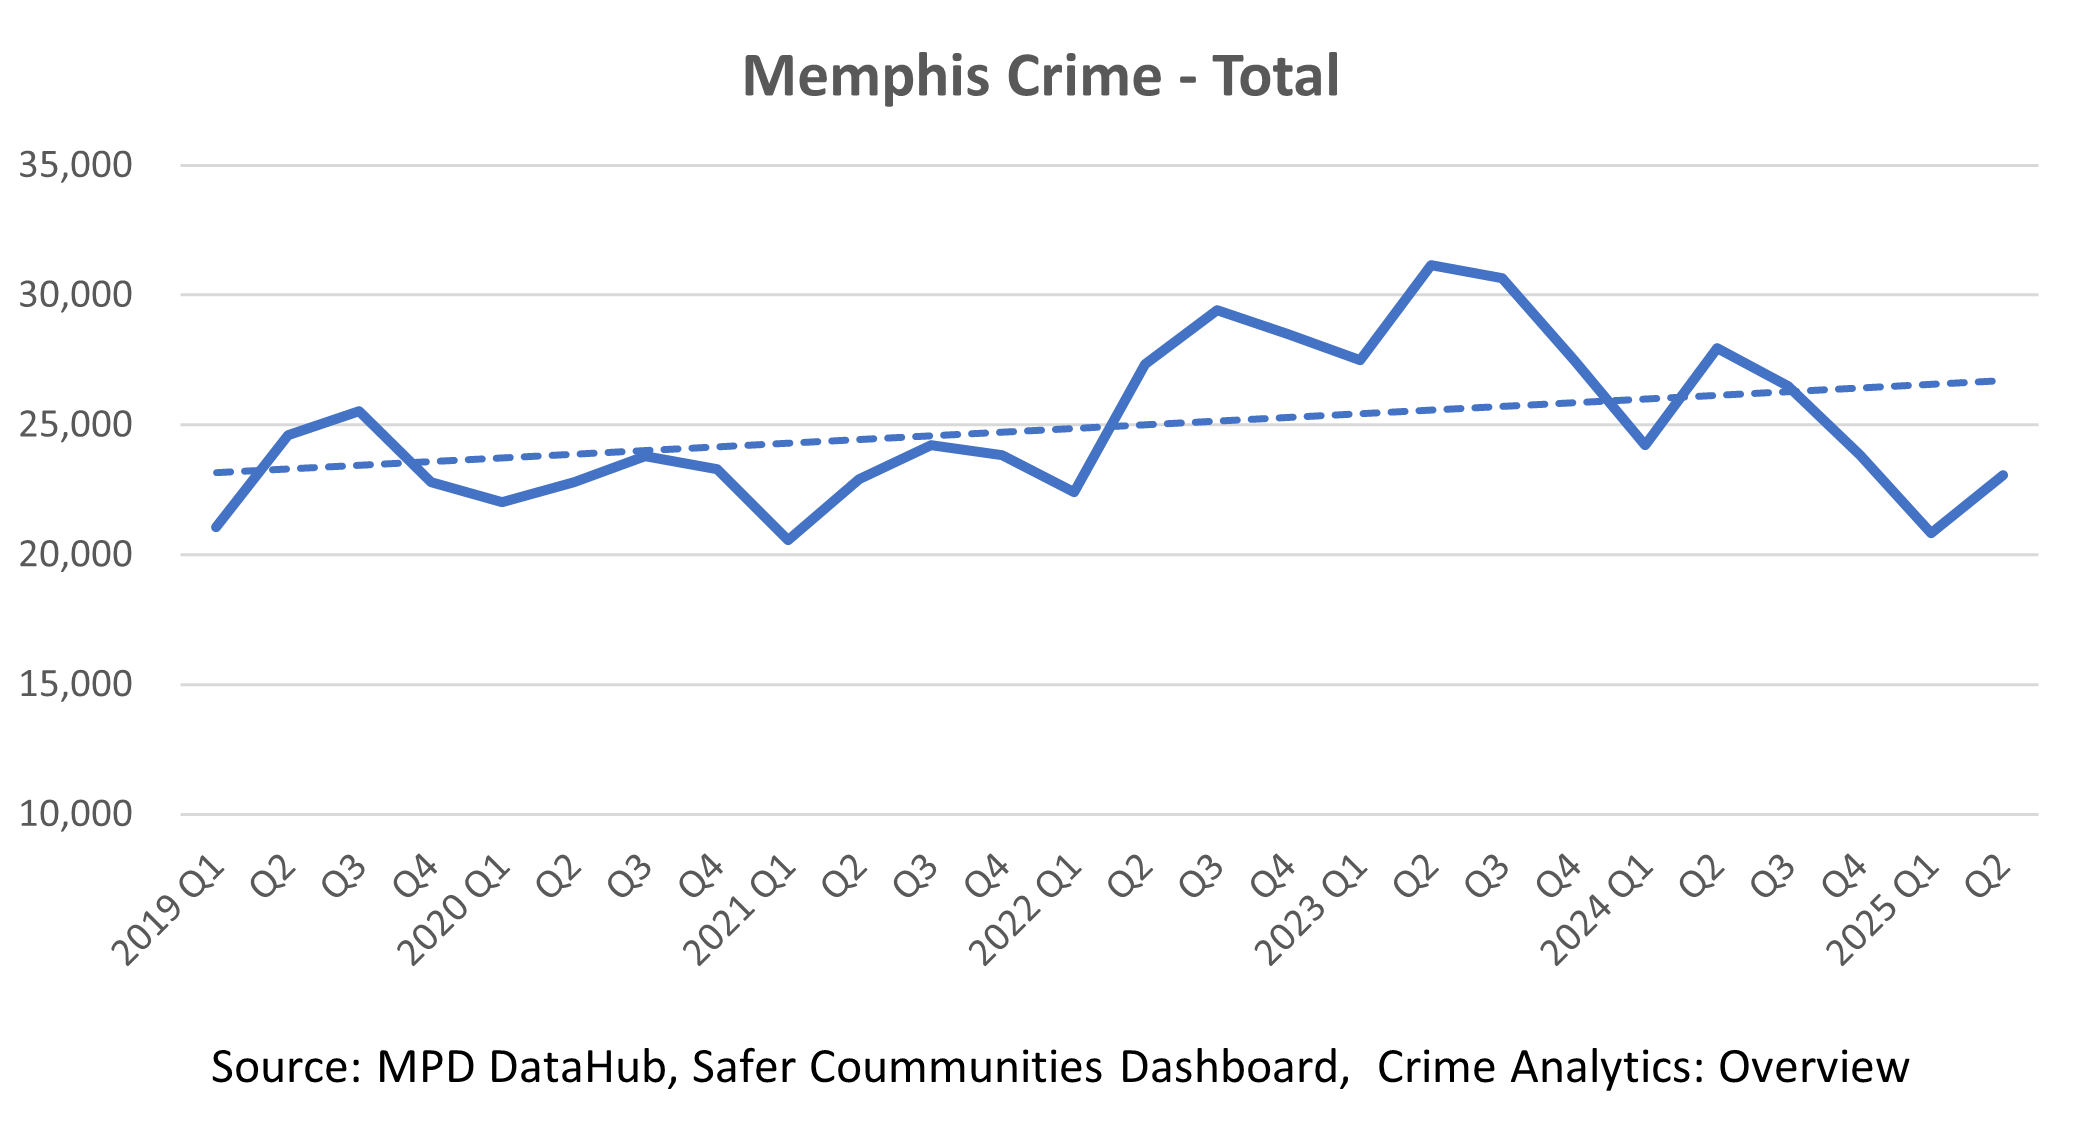
CRIME STATS FOR MEMPHIS
AS OF JUL 7, 2025
The data uses the MPD Data Hub database with the exception of sex crimes. Sex crime data uses the Crime Analytics: Overview for 2019 and the Safer Communities Dashboard for 2020 - current. These numbers vary slightly from the crime figures recently released to the press. We are working on reconciling and understanding the differences.
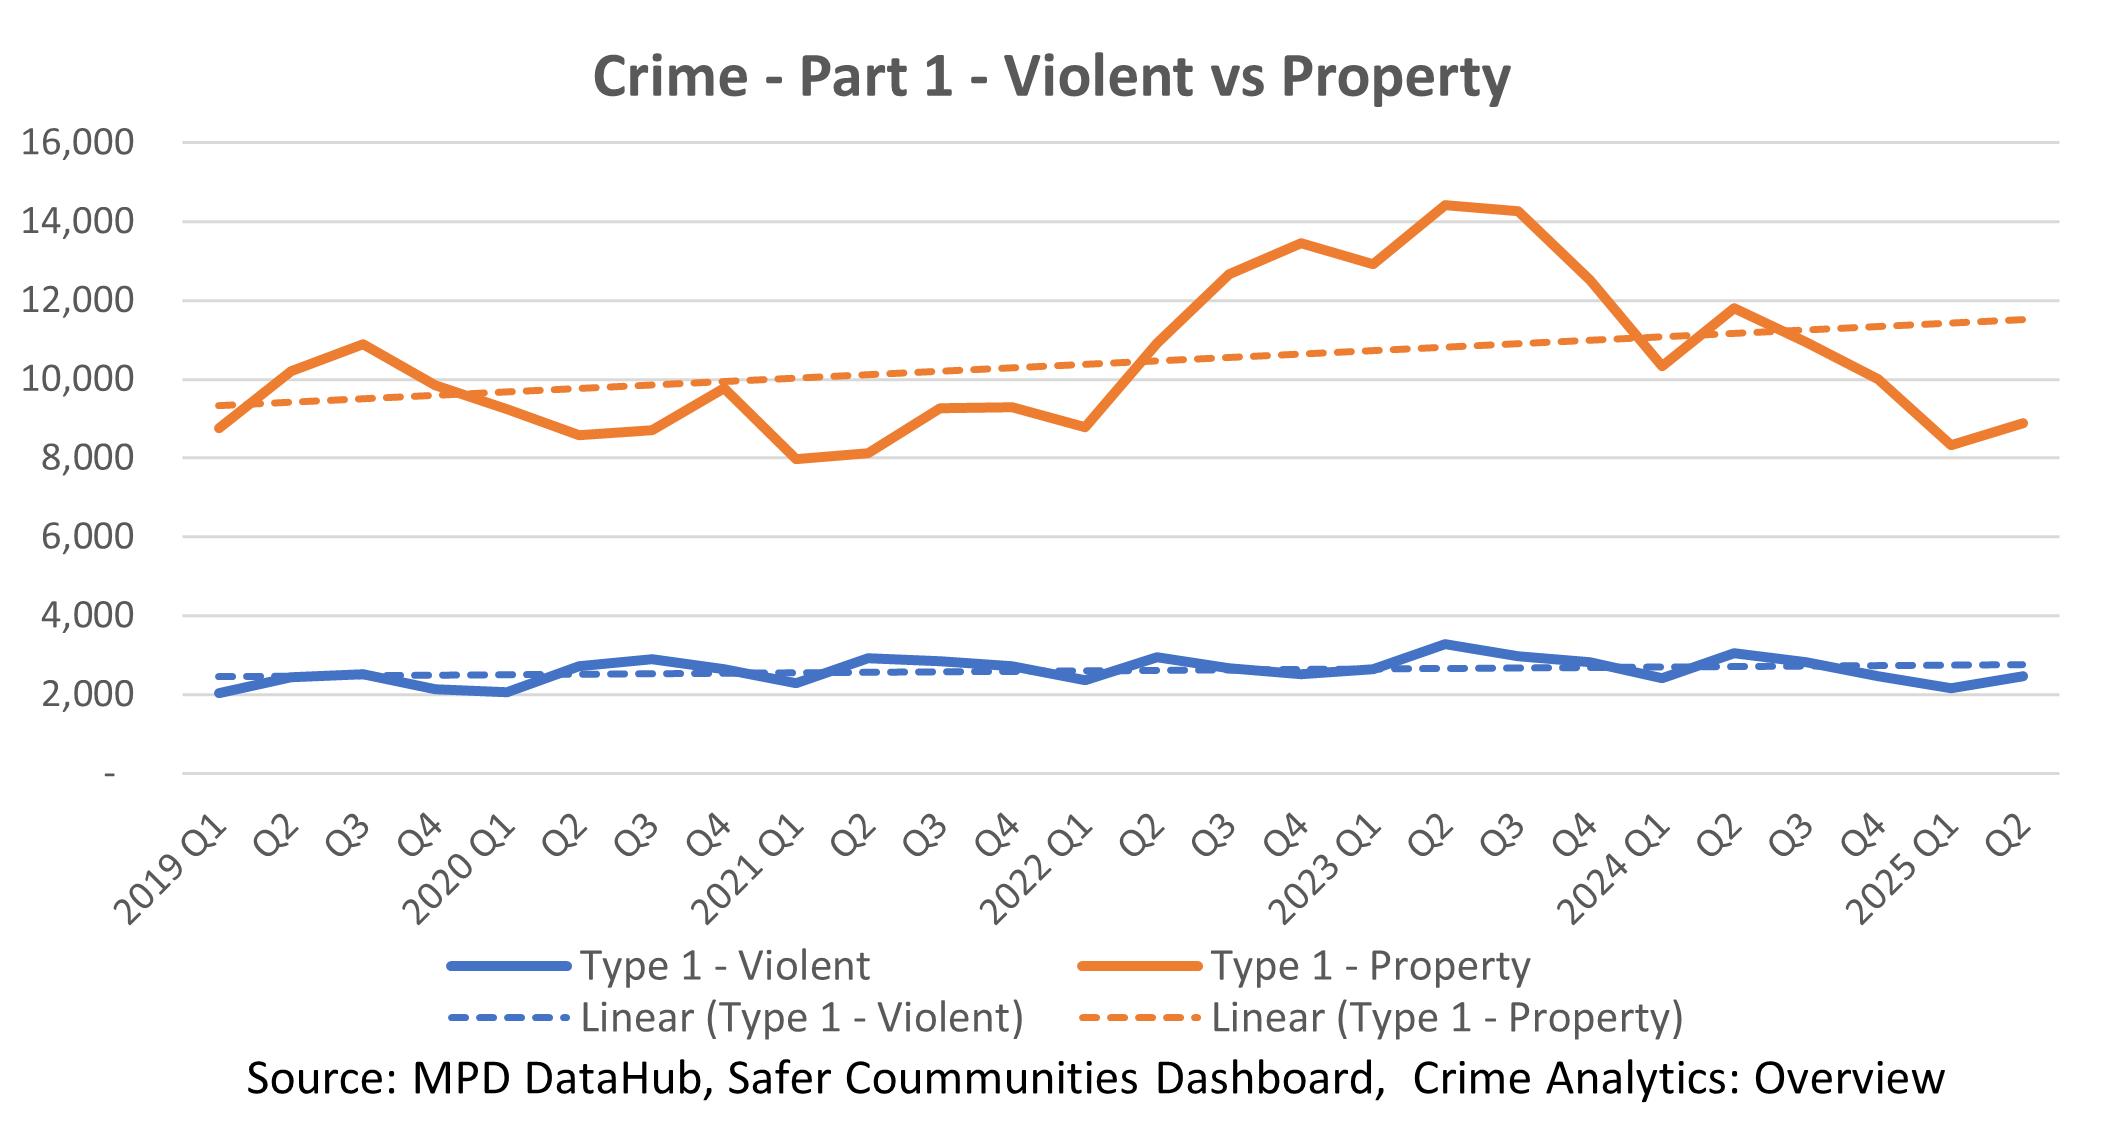
Violent includes Aggravated Assault, Robbery, Murder, Arson, some Sexual Offense. Property includes Larceny, Burglary, Motor Vehicle Theft.
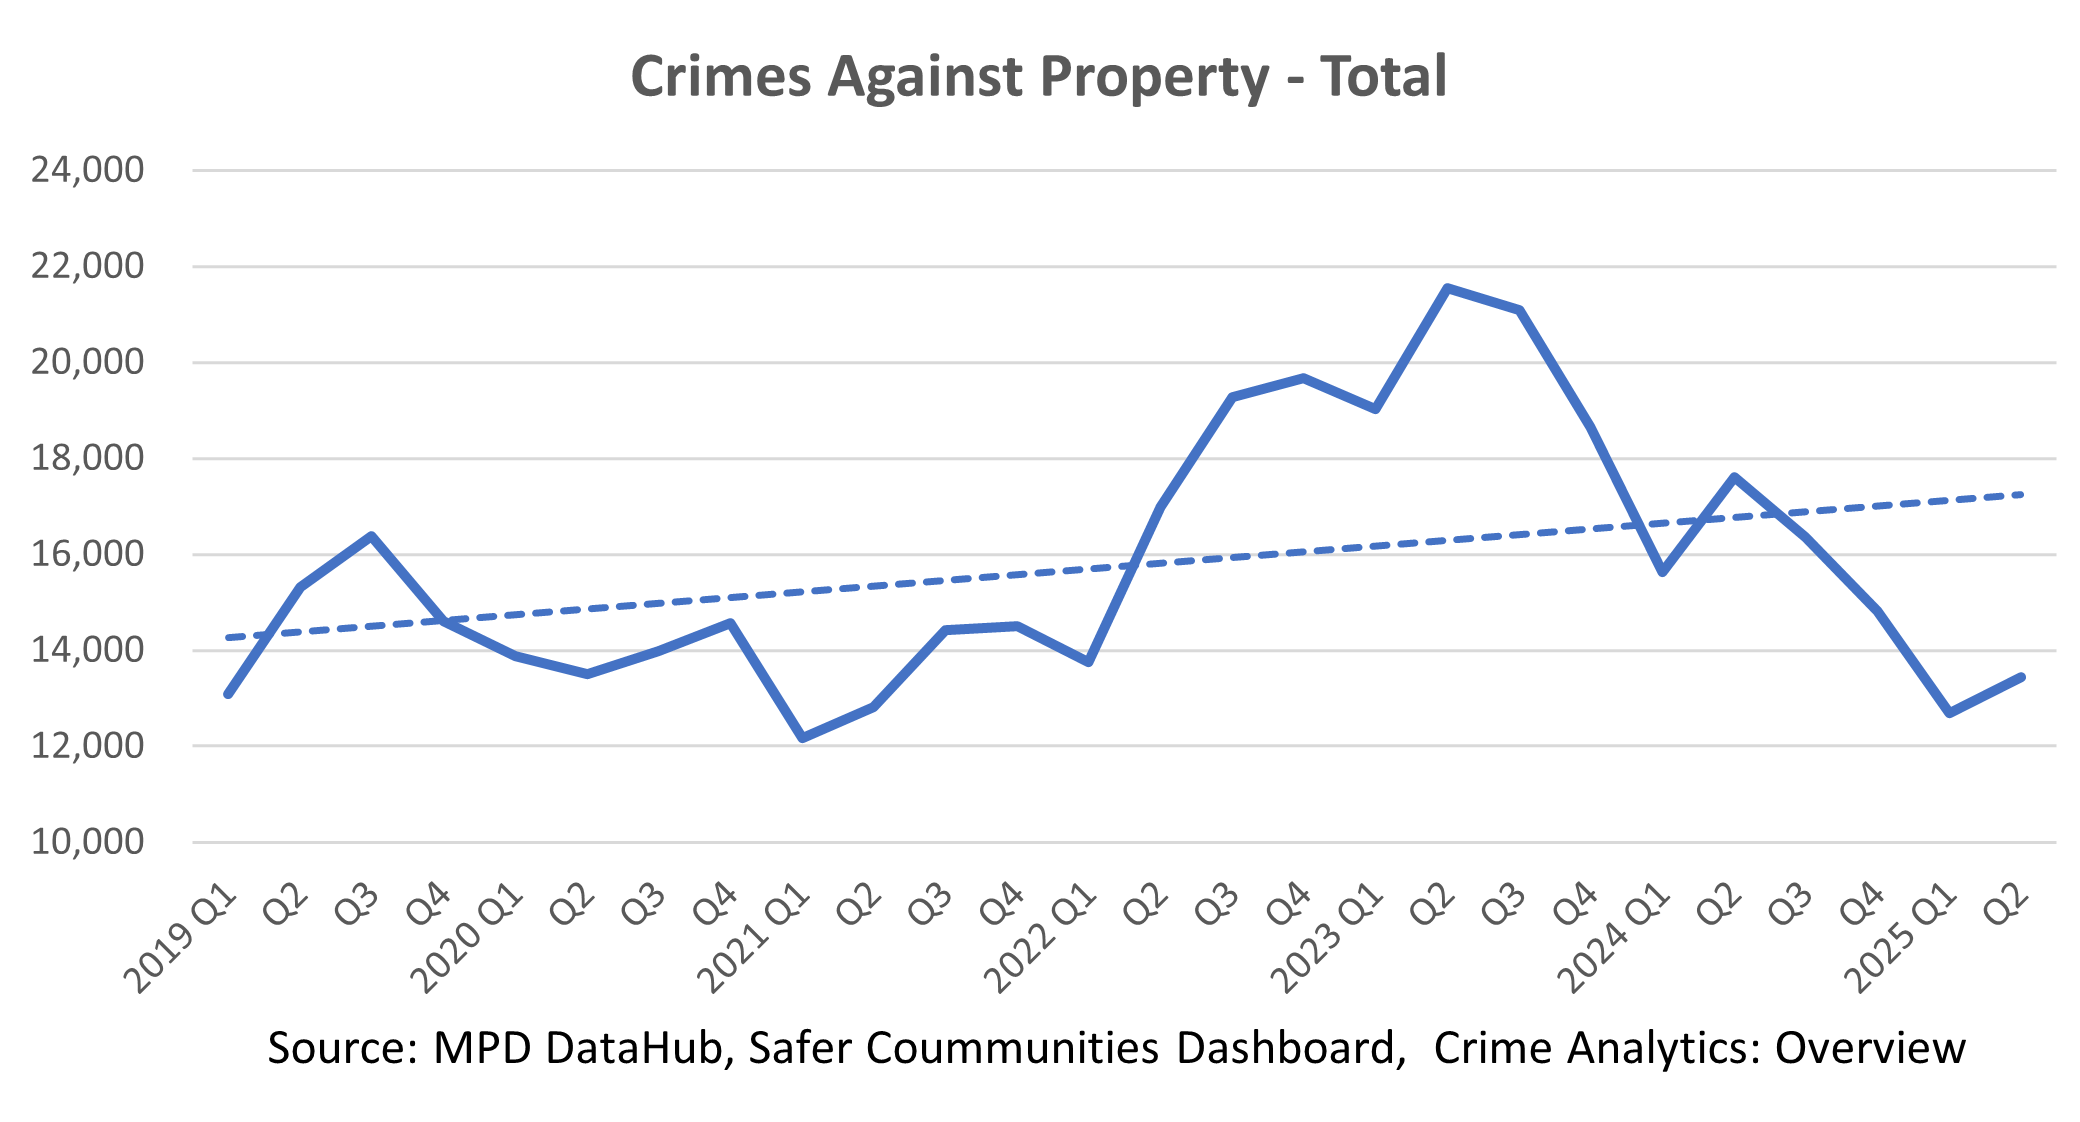
Crimes against Property include larceny/theft, vandalism, motor vehicle theft, burglary, fraud, robbery
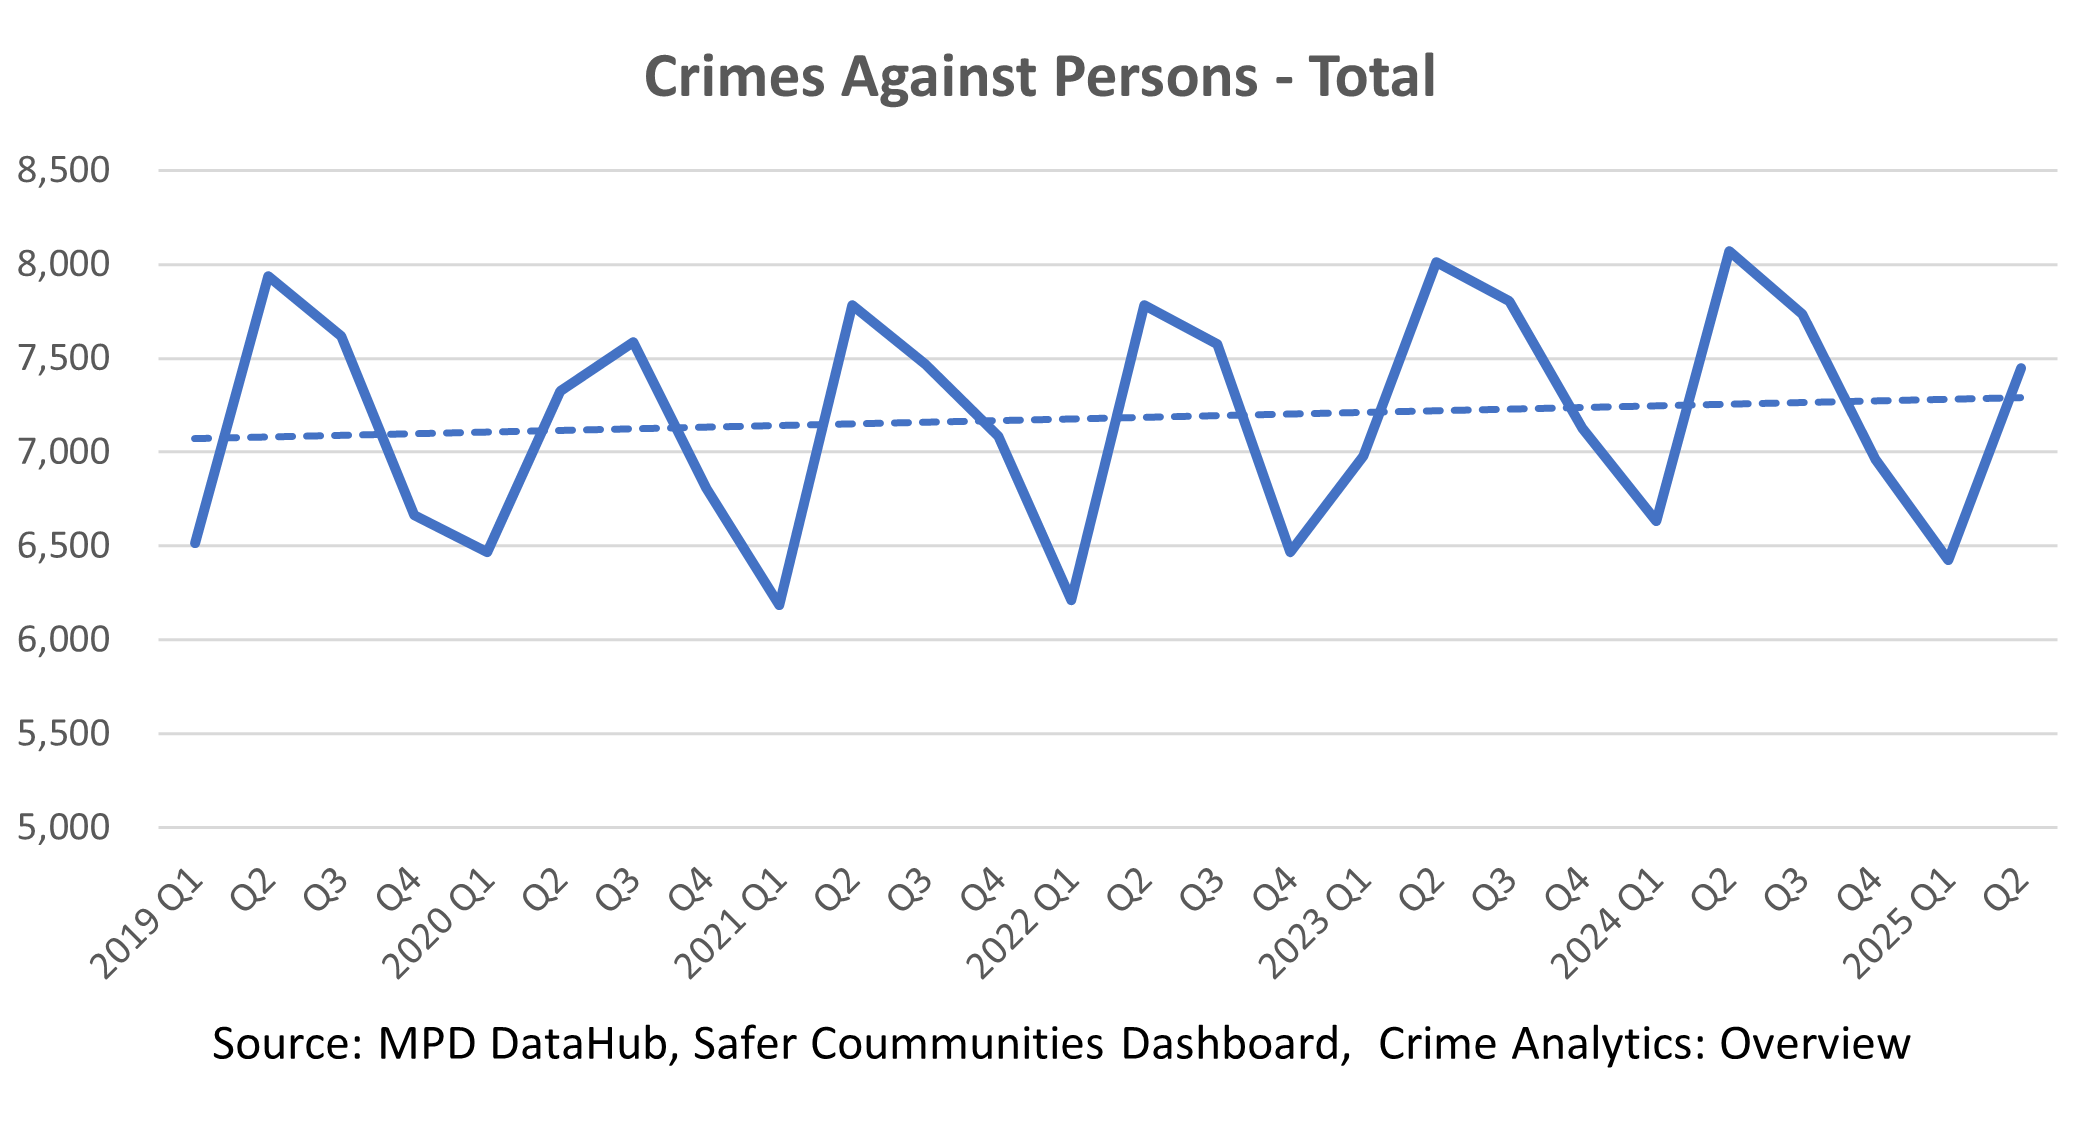
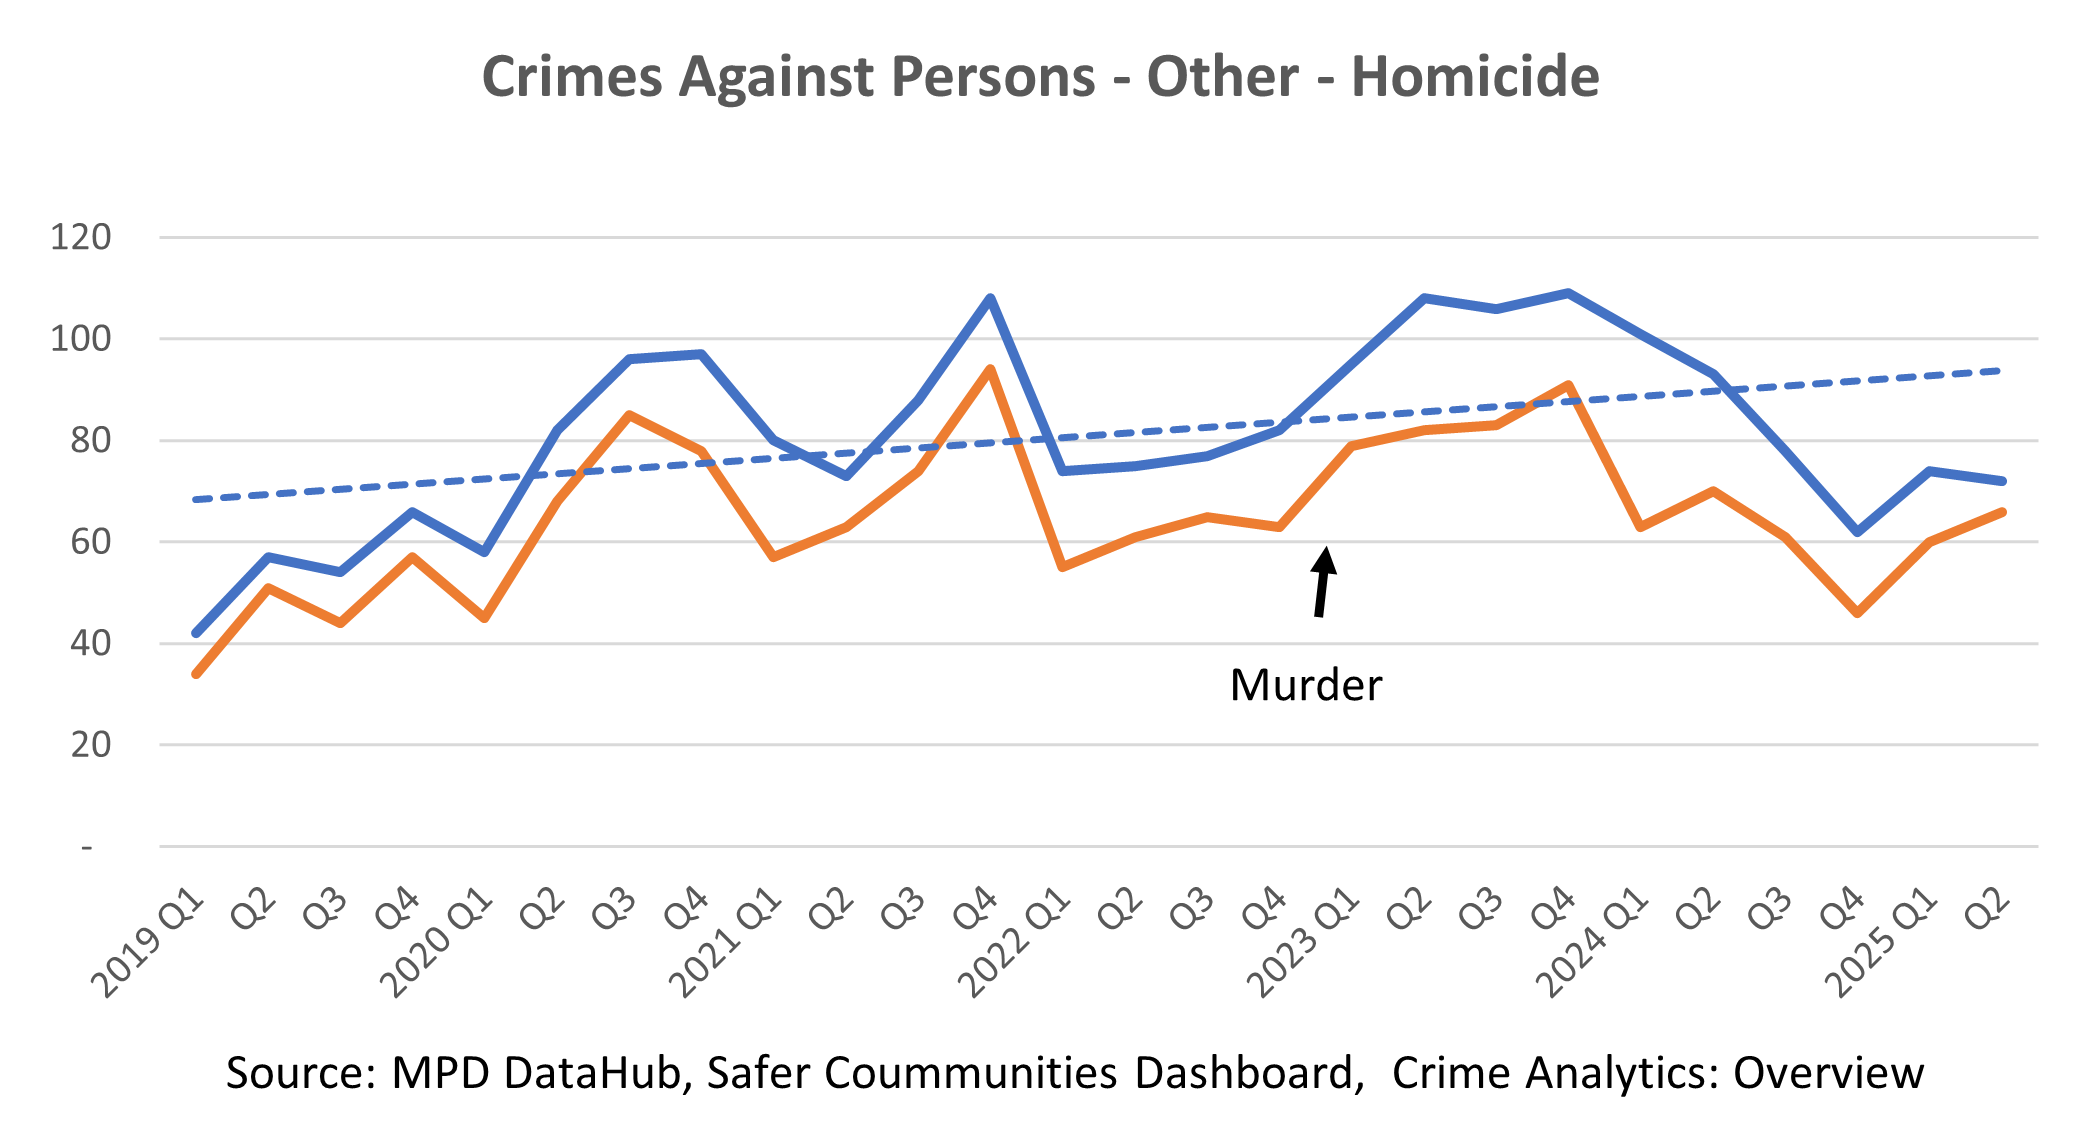
Crimes against Persons include simple and aggravated assault, homicide, sexual offenses, kidnapping
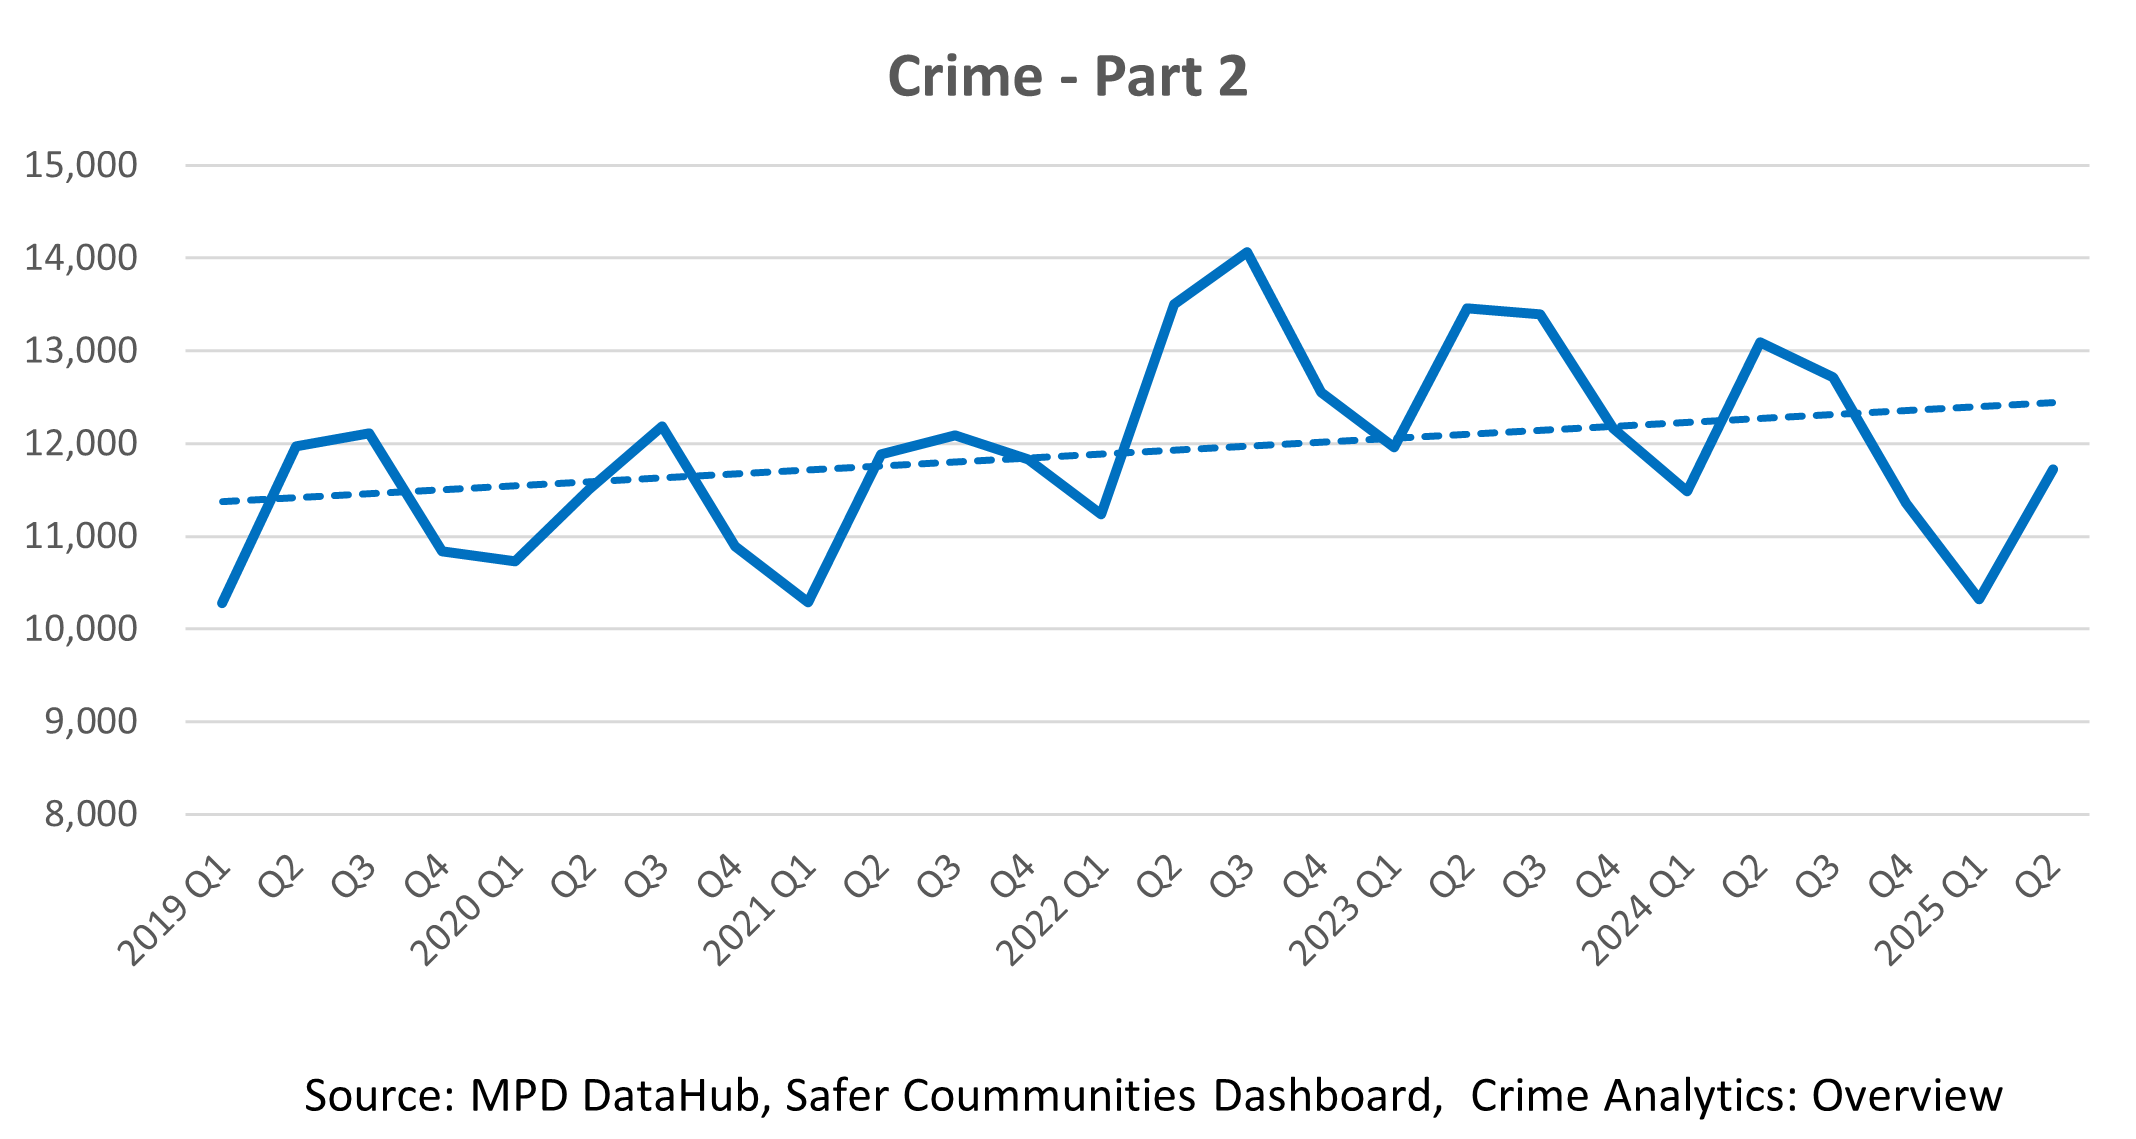
Main drivers include Simple Assault, Vandalism, Fraud, Drugs, Weapons, some Sexual Offenses
Other graphs of interest:

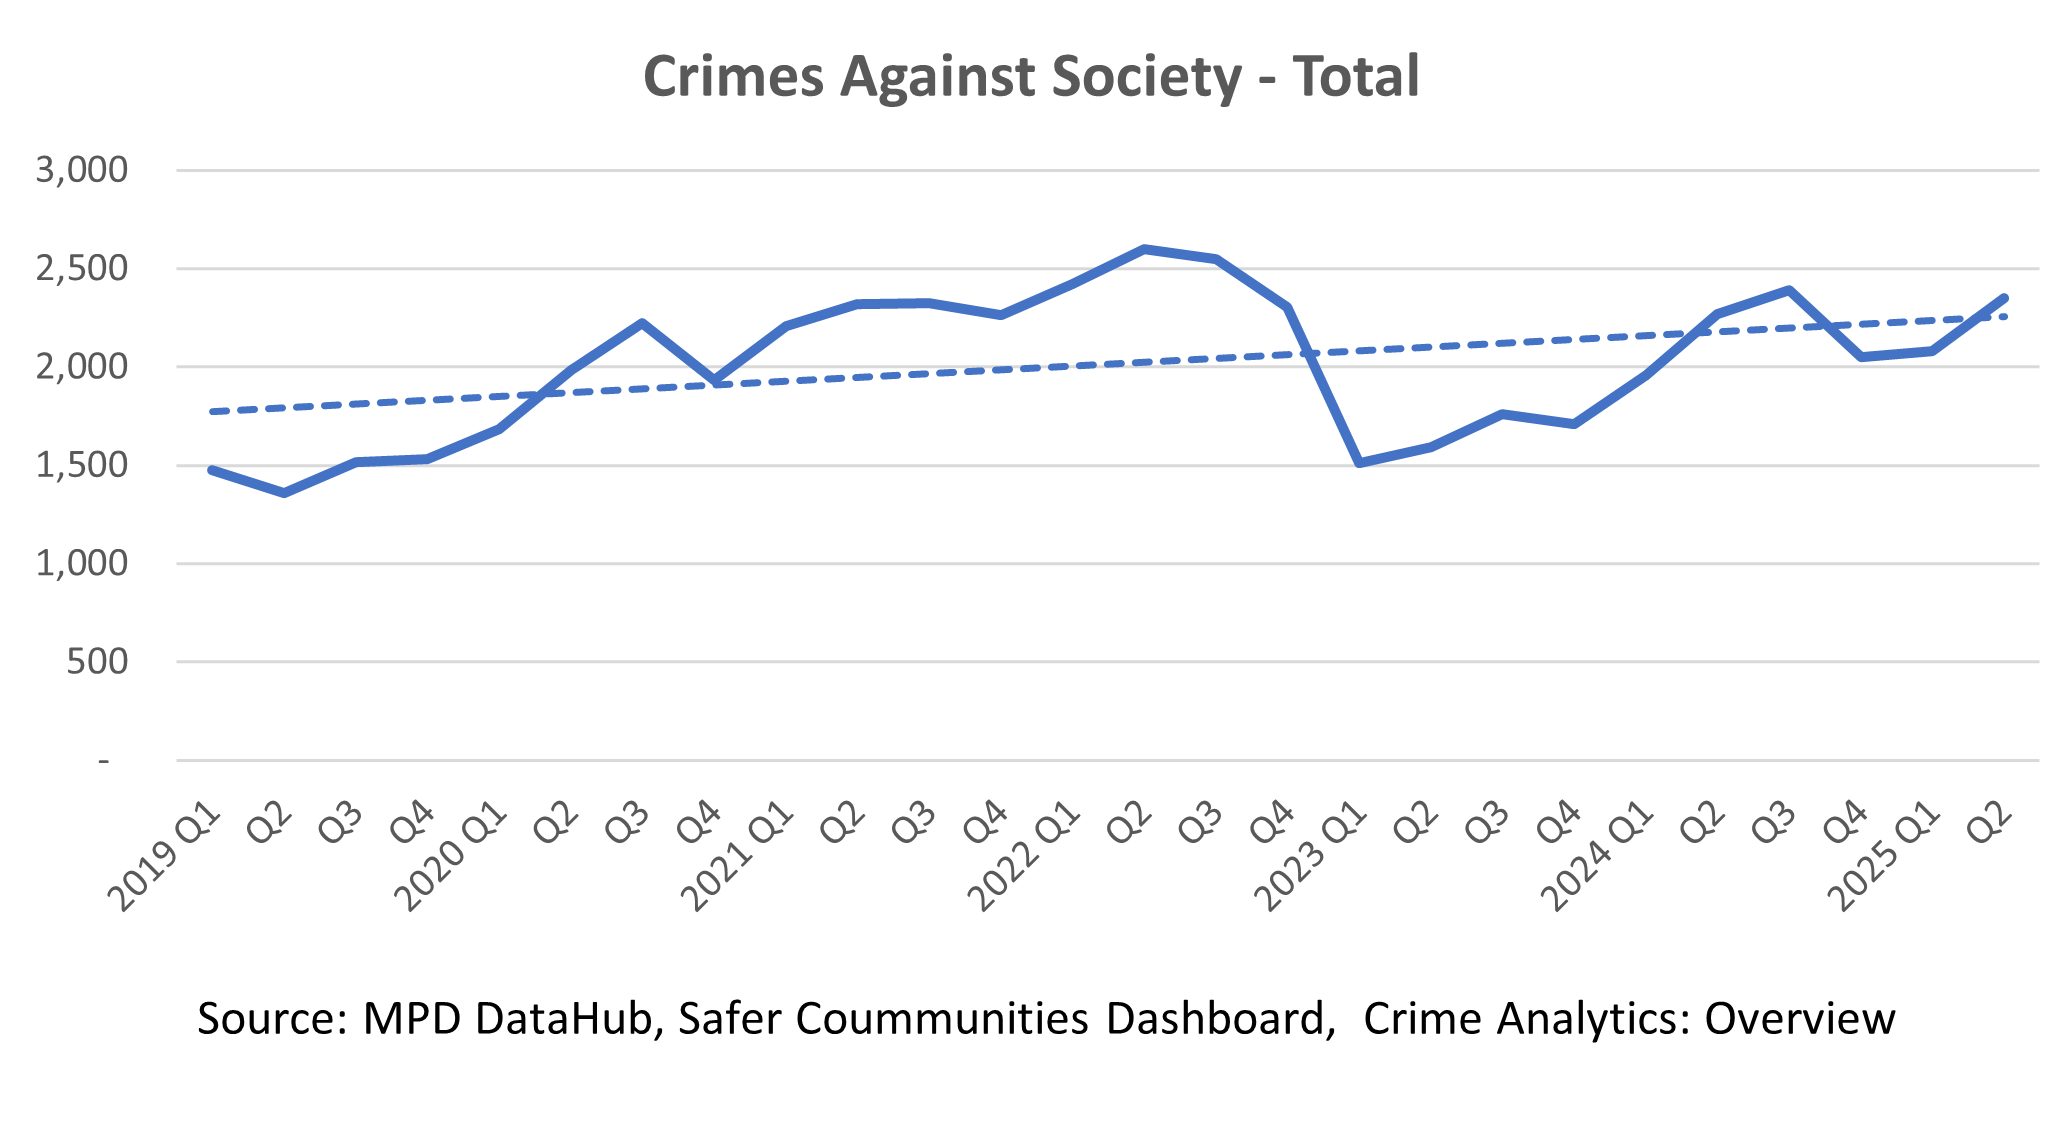
Crimes against Society include drug and weapon crimes
OVERALL CRIME
PROPERTY
LARCENY/ THEFT
MOTOR VEHICLE THEFT
PERSON
SIMPLE ASSAULT
AGGRAVATED ASSAULT
SOCIETY
WEAPON LAW VIOLATION
DRUGS
MAJOR CRIME
MAJOR VIOLENT CRIME
MAJOR PROPERTY CRIME
Q2 YTD % Change
2022-2023
18%
32%
19%
131%
7%
7%
7%
-38%
-27%
-48%
33%
11%
39%
For more detail, click here:
2023-2024
-11%
-18%
-13%
-31%
-2%
-3%
0%
36%
62%
22%
-17%
-8%
-15%
-19%
-17%
-37%
5%
2024-2025
- 15%
-21%
-6%
-1%
-15%
5%
5%
-21%
-22%
OVERALL CRIME
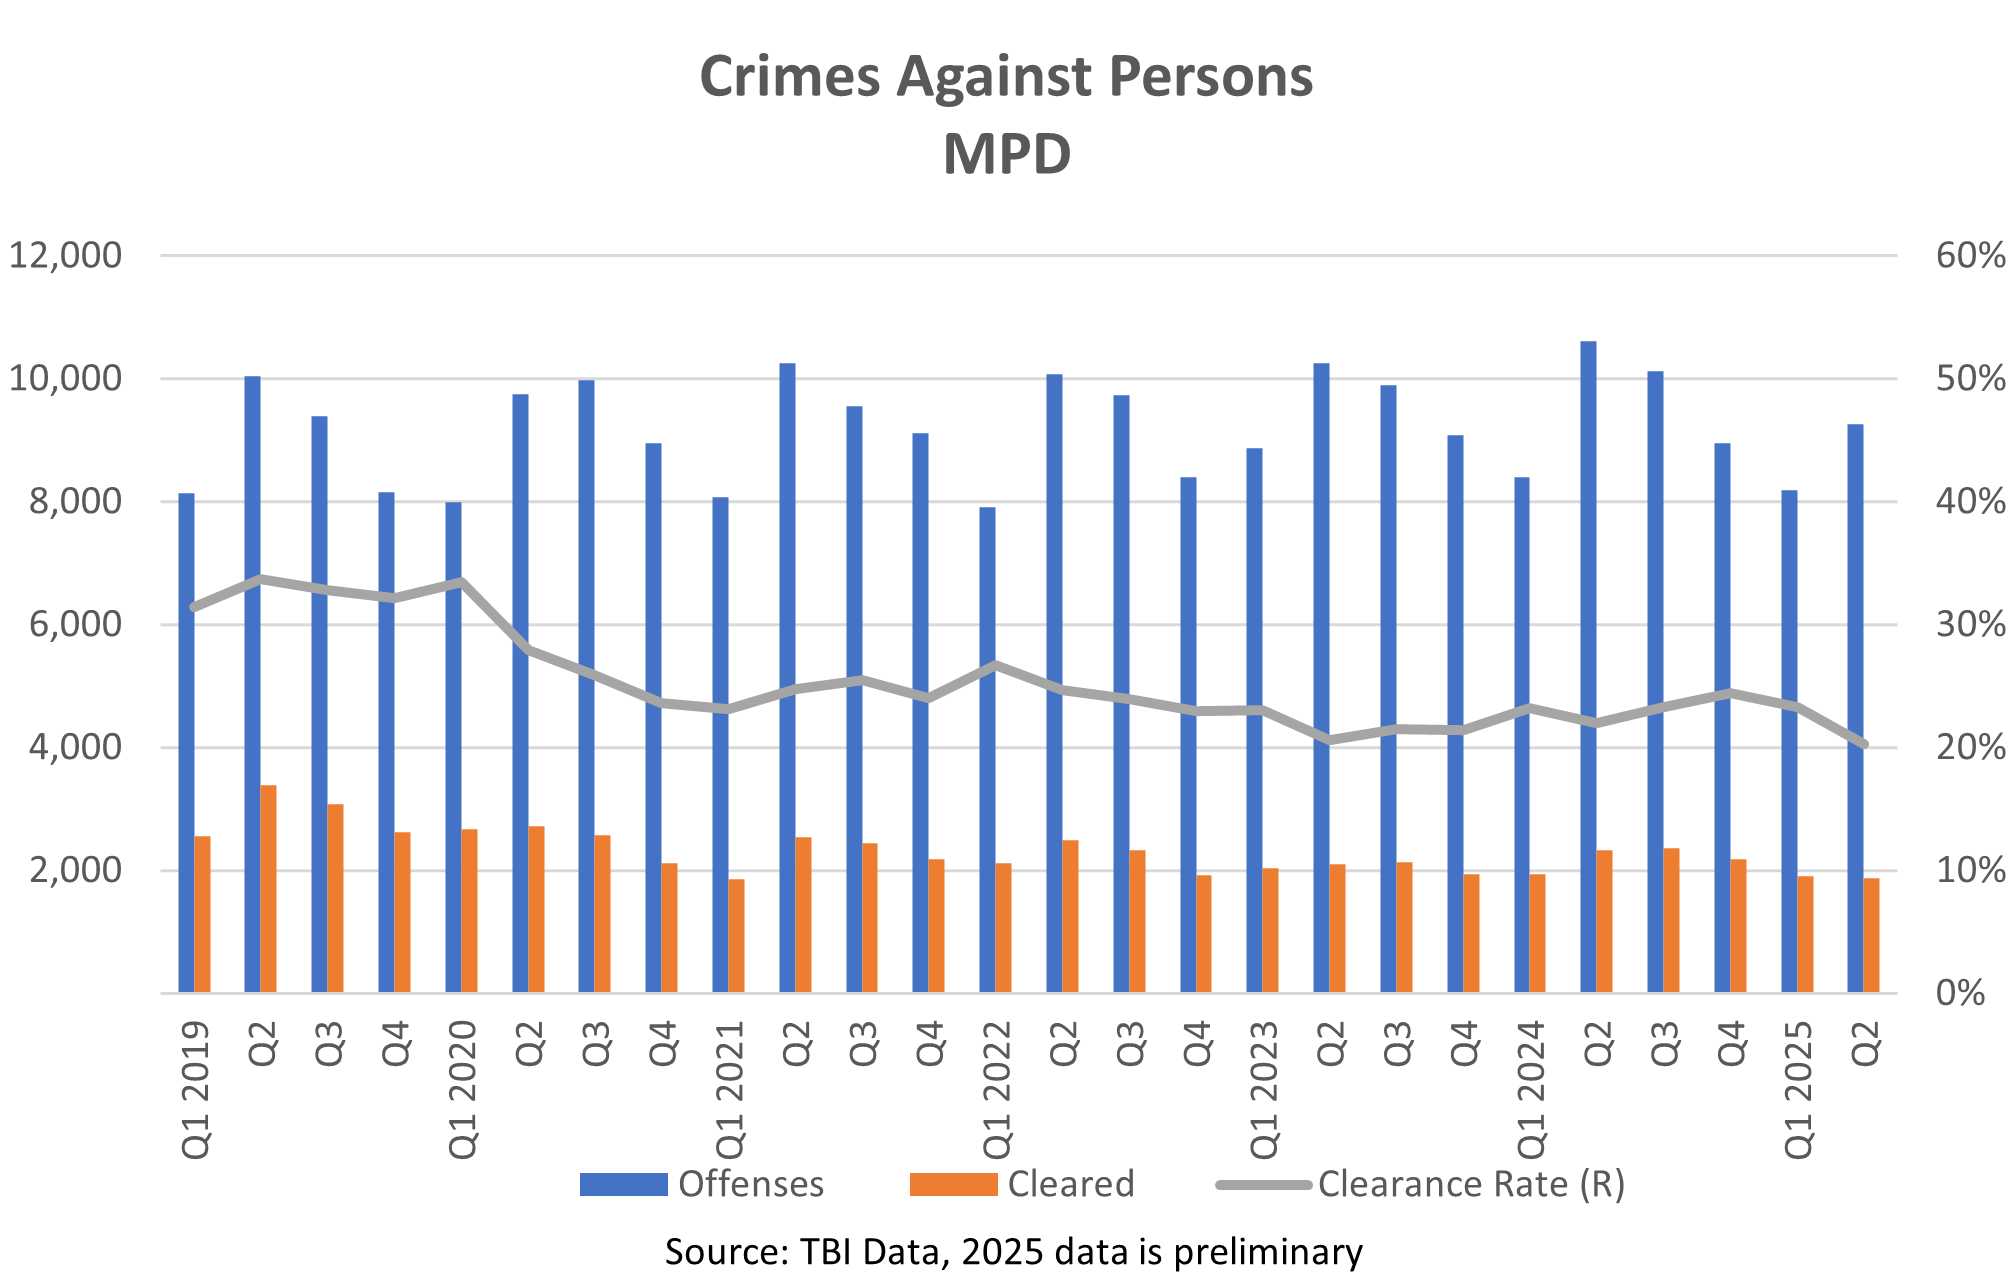
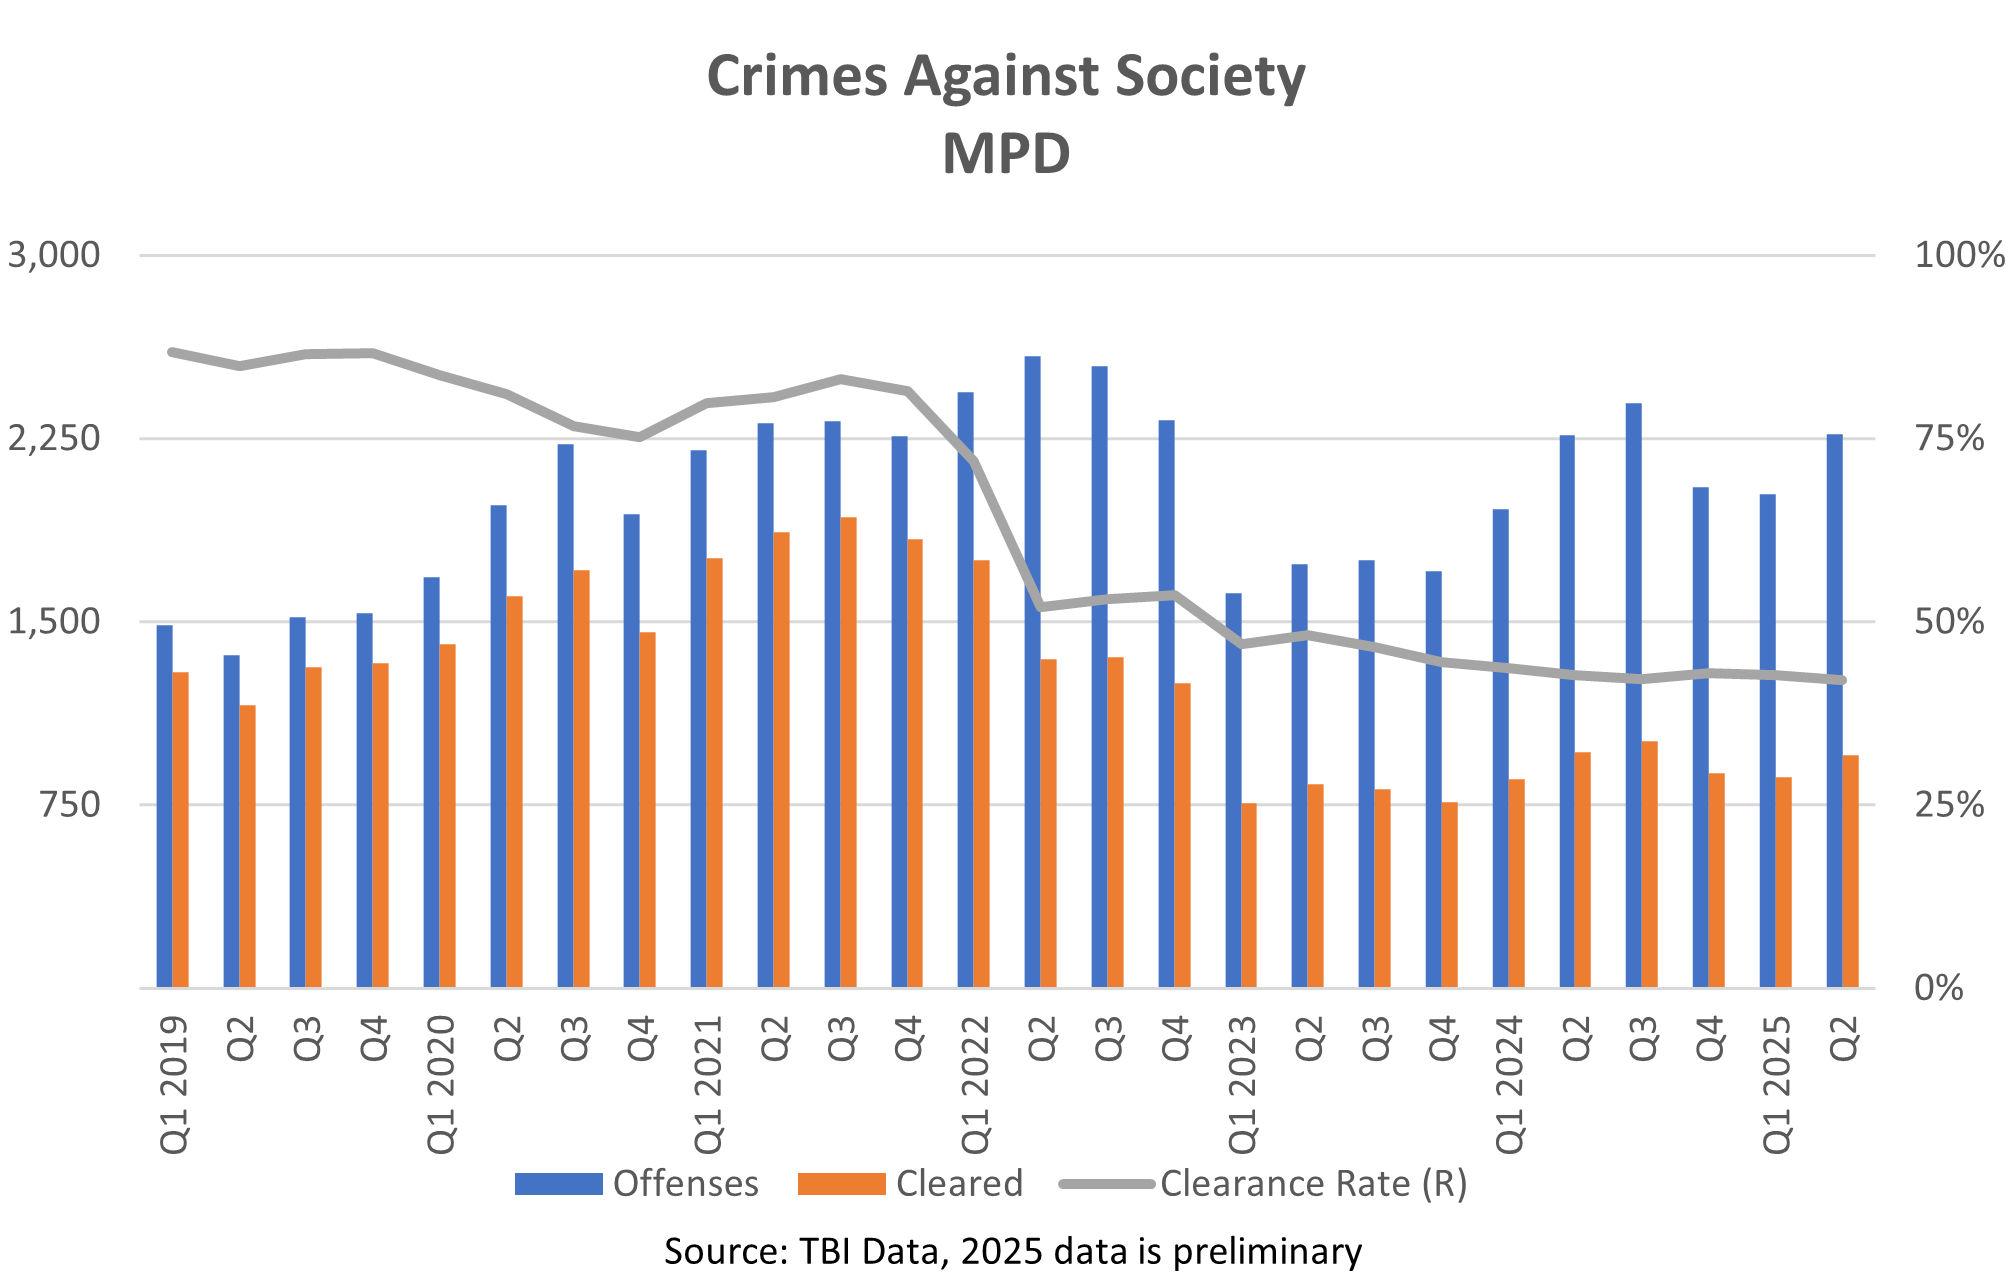
clearance rates for mpd
Source: TBI—subject to revisions. Data as of Jul 11, 2025

Clearance Rates
Total
Crimes Against Persons
Aggravated Assault
22%
Simple Assault
Murder
Crimes Against Property
Shoplifting
Vandalism
Crimes Against Society
Drugs
Weapons
2022
18%
25%
32%
47%
10%
17%
10%
58%
64%
48%
2023
14%
22%
18%
30%
29%
8%
16%
9%
47%
56%
36%
2024
17%
23%
19%
33%
26%
10%
20%
11%
43%
59%
31%
For more detail, click here:
2025 ytd
17%
10%
12%
18%
22%
19%
30%
26%
42%
58%
31%

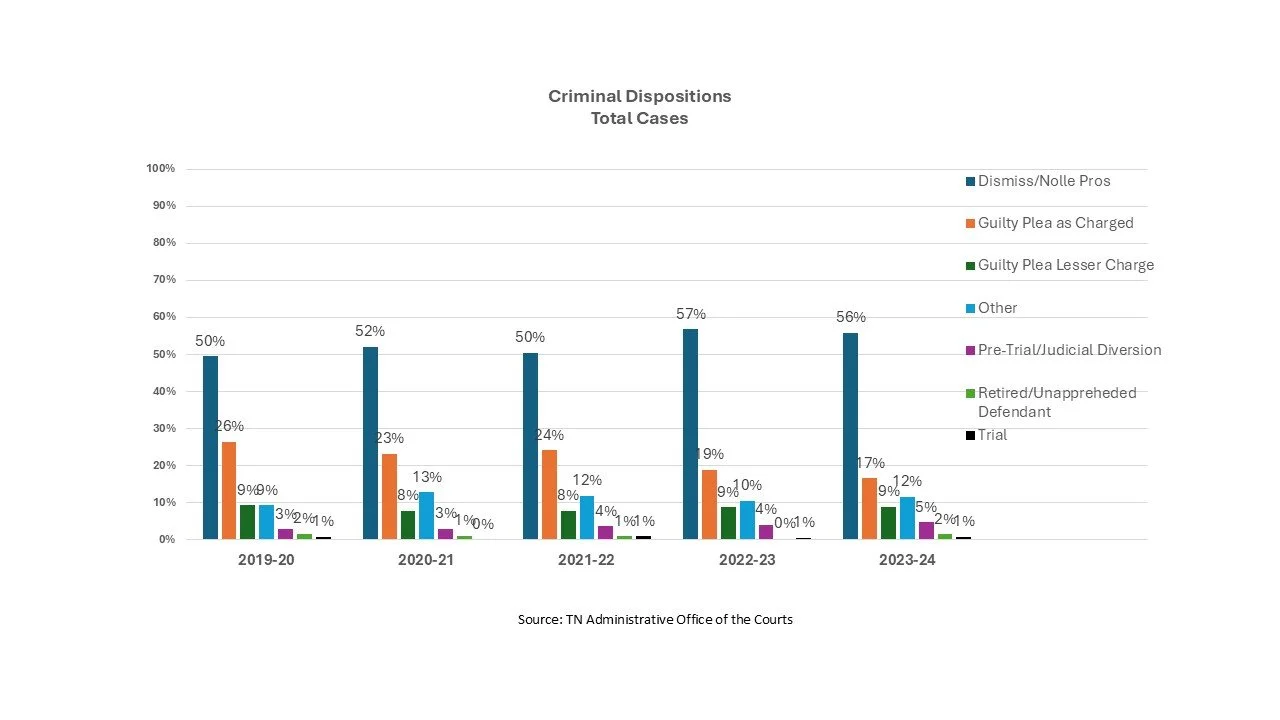
Case Dispositions for Shelby County
Data from the Administrative Office of the Courts